


Abstract
The role of cardiopulmonary exercise testing (CPET) in predicting major adverse cardiovascular events (MACE) in people with congenital heart disease (ConHD) is unknown. A systematic review with meta-analysis was conducted to report the associations between CPET parameters and MACE in people with ConHD.
Electronic databases were systematically searched on 30 April 2020 for eligible publications. Two authors independently screened publications for inclusion, extracted study data, and performed risk of bias assessment. Primary meta-analysis pooled univariate hazard ratios across studies. A total of 34 studies (18 335 participants; 26.2 ± 10.1 years; 54% ± 16% male) were pooled into a meta-analysis. More than 20 different CPET prognostic factors were reported across 6 ConHD types. Of the 34 studies included in the meta-analysis, 10 (29%), 23 (68%), and 1 (3%) were judged as a low, medium, and high risk of bias, respectively. Primary univariate meta-analysis showed consistent evidence that improved peak and submaximal CPET measures are associated with a reduce risk of MACE. This association was supported by a secondary meta-analysis of multivariate estimates and individual studies that could not be numerically pooled.
Various maximal and submaximal CPET measures are prognostic of MACE across a variety of ConHD diagnoses. Further well-conducted prospective multicentre cohort studies are needed to confirm these findings.
Implications for research and practice:
In future all studies should:
1. Explicitly report any adverse events that occurred during CPET.
2. If clinically approrpiate and feasible, studies should confirm a plateau in oxygen consumption to validate a peak effort.
3. Prospectively register their trials and follow the appropriate reporting frameworks (REMARK for prognostic factors).
4. Report the hazard ratio (or equivalent summary statistic) of all scales of the prognostic factor and avoid dichotomising continuous predictor data.
5. Control for common covariates such as age at the test and resting oxygen saturations as a minimum.
Introduction
Cardiorespiratory fitness (CRF) can be assessed using cardiopulmonary exercise testing (CPET) and can be quantified using parameters such as peak oxygen consumption (peak O2), exercise efficiency slopes [i.e. oxygen uptake efficiency slope (OUES)], submaximal ventilatory thresholds [i.e. gas exchange threshold (GET)], and other physiological responses to an exercise stimulus [i.e. heart rate reserve (HRR), exercise oscillatory ventilation (EOV)].1,2 Cardiopulmonary exercise testing is recommended as a part of routine care in people with congenital heart disease (ConHD) by the European Society of Cardiology.3
Congenital heart disease represents a spectrum of cardiac (and/or intrathoracic vessel) defects present at birth,4 and is the most common birth defect with approximately 1% of the global population affected.5 People with ConHD can have reduced CRF compared to healthy controls,6–8 and a 2018 systematic review reported that reduced CRF is associated with major adverse cardiovascular events (MACE) in people with Fontan circulations.9 Major adverse cardiovascular events is a widely used composite clinical endpoint in cardiovascular research, encompassing a range of morbidities and mortalities. Although it does not have a standardized definition, it allows researchers to capture patient-important outcomes, which may vary due to specific populations or interventions.
Prognostic factors research aims to associate clinical parameters (i.e. CRF), to future health status (i.e. MACE). Prognostic factors are important to identify as they can be used to inform treatment options, risk stratification, and can aid in the design and evaluation of clinical trials.10 The 2020 Cochrane review on ‘physical activity interventions for people with ConHD’, called for an urgent review on the prognostic importance of CRF, allowing future research to design and evaluate interventions more effectively.11
Whilst many studies have been published on the associations between measures of CRF-derived from CPETs and future outcome in ConHD, no previous systematic review has comprehensively synthesized this evidence across all types of ConHD. Therefore, the aim of the current paper was to assess the role of CPET in the prognosis of MACE in all types of ConHD. This study was conducted using contemporary systematic review and meta-analysis methodological guidance.10,12
Methods
Registration
The protocol for this systematic review was prospectively registered on Prospero (CRD42020186518) and published in the Journal of Congenital Cardiology.13 Ethical approval was not required.
Participants and study types
Studies that reported data on patients with a confirmed diagnosis of structural ConHD were included (Table 1). Degenerative, infective, and other inherited pathologies (i.e. channelopathy, cardiomyopathy) were excluded.
Summary of patients pooled into the meta-analysis
| ConHD diagnoses | All cohorts (paediatric arms) | No. of all patients (paediatric only) | Pooled mean age and SD (paediatric mean age and SD) | Mean percentage male (%) and SD |
|---|---|---|---|---|
| Fontan | 12 (2) | 1897 (204) | 21.1 ± 4.6 | 59.5 ± 9.4 |
| (13.3 ± 4.6) | ||||
| Tetralogy of Fallot | 10 (1) | 2595 (40) | 28.4 ± 9.0 | 58.9 ± 7.9 |
| (9.0 ± 0) | ||||
| Mixture of ConHD | 8 (0) | 16 047 | 32.5 ± 2.5 | 54 ± 3.4 |
| Transposition of the great arteries | 5 (0) | 512 | 31.5 ± 4.5 | 63.9 ± 5.7 |
| Ebstein anomaly | 2 (0) | 117 | 37.8 ± 0a | 49 ± 0a |
| Repaired coarctation of the aorta | 1 (0) | 138 | 40 ± 0a | 59 ± 0a |
Only one study reports numeric statistic; transposition of the great arteries cohort are people with a systemic right ventricle post-Senning/Mustard procedure.
All study designs that addressed the research question were considered for inclusion. Only peer-reviewed full-text papers written in English were included. Previous reviews or case reports were excluded.
Cardiopulmonary exercise testing methods
Cardiopulmonary exercise testings protocols using a cycle or treadmill ergometer that simultaneously measured pulmonary gas exchange were included. Any CRF parameter that can be obtained from a CPET was eligible for inclusion. Tests that used other exercise modalities and/or did not directly measure pulmonary gas exchange were excluded.
Outcomes
Studies that reported MACE endpoints were included. Where studies reported several endpoints including a MACE composite (i.e. death, hospitalization, MACE), the MACE composite endpoint was extracted preferentially. Finally, where a composite MACE outcome was not reported by a study, but a more specific endpoint was (i.e. death, transplant, initiation of a ventricular assist device, cardiac, and/or unscheduled hospitalization), these outcomes were pooled within the analyses.
Search methods
The following electronic databases were searched: Allied and Complementary Medicine Database (EBSCO), CINAHL® Complete (EBSCO), SPORTDiscus (EBSCO), Medline (Ovid), Embase (Ovid), Web of Science (Thomson Reuters), and Cochrane Central Register of Controlled Trials.
Searches were performed on 30 April 2020 with no lower limit on publication date. Forward and backward citation chasing was also performed. The search terms included prognosis (mortality, morbidity, event-free survival etc.) with ConHD [Fontan, Tetralogy of Fallot (ToF) etc.] and CPET parameters (peak O2, OUES etc.). The full search strategy is provided in the published protocol.13
Data collection
Two independent researchers (C.A.W. and M.E.W.) screened titles and abstracts using Covidence® (Veritas Health Innovation Ltd., Melbourne, Australia). Full texts were retrieved and read to confirm their inclusion by two independent researchers [C.A.W. (100%), M.E.W. (25%), and D.M.D. (75%)]. Any disagreements were resolved by consensus; reasons for full-text exclusion have been made explicit in Supplementary material online, and the selection process has been reported using a PRISMA flow diagram (Figure 1).14,15
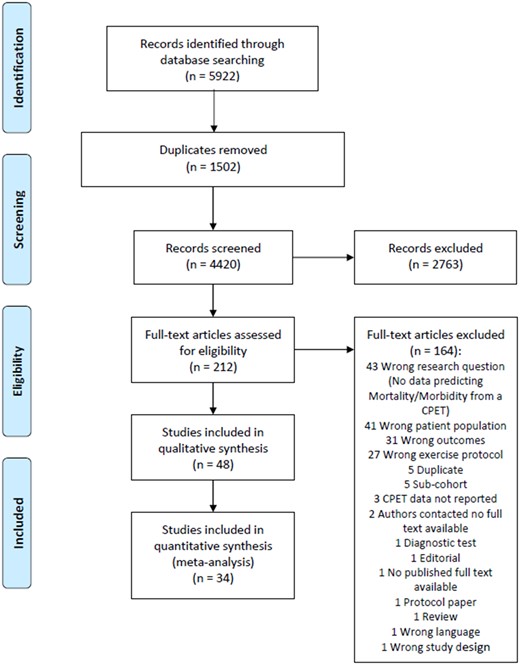
Study selection flow diagram.
Data were extracted independently by two researchers (C.A.W. and D.M.D.) using a piloted version of the ‘critical appraisal and data extraction for systematic reviews of prediction modelling and prognostic factors studies’ (CHARMS-PF) checklist.16 Odds and hazard ratios (HRs) with 95% confidence intervals (95% CIs) were extracted for each CPET parameter and type of ConHD. When studies reported the individual ConHD subgroups and the overall pooled estimates (of multiple diagnoses) the individual ConHD subgroup data were extracted preferentially. Data presented in figures were extracted using Web Plot Digitizer (Ankit Rohatgi, version 4.4, CA, USA); and when not reported (or directly calculable from 95% CI), standard errors were estimated using the mean HR and P-value using validated methods.17
Risk of bias assessment
Risk of Bias (RoB) assessments were conducted by C.A.W. and D.M.D. independently using the Cochrane adopted ‘Quality in Prognosis Studies’ (QUIPS) tool.18 Six domains were evaluated: study participation, study attrition, prognostic factors, outcome measurement, study confounding, and statistical analysis. Disagreements were discussed until consensus was reached or were arbitrated by a third author (C.A.W.). Each domain was graded as either having low, moderate, or high RoB, and written justifications were provided (Supplementary material online).
Data synthesis and investigation of heterogeneity
Der Simonian–Laird meta-analysis with 95% CI were performed on log-transformed HR. Random effects meta-analysis was used for all analyses due to the anticipated and present heterogeneity. Congenital heart disease diagnoses and CPET parameters were combined; where two or more studies reported the same ConHD/CPET combination and a univariate HR they were pooled into the ‘primary analysis’. Only CPET parameters reported on a continuous scale were pooled. Studies that reported HR computed from dichotomous CPET parameters (i.e. peak O2 <18 mL·kg−1·min−1, or present/absent), and/or only had one ConHD/CPET combination were pooled separately (Supplementary material online). The ventilatory equivalent for carbon dioxide (E/CO2) slope has the opposite direction to other CPET variables (i.e. lower values indicate better CRF), to pool this variable in the analysis the direction of the effect was corrected for.
A ‘secondary analysis’ was produced to analyse studies that reported multivariate data. The univariate and multivariate associations from these studies were analysed and presented side-by-side. Studies that performed multiple bivariate analyses (controlled for one covariate at a time) were included; however, the covariate with the most conservative P-value was chosen to enter the analysis, avoiding double counting. Hazard ratios computed from CPET parameters using dichotomous scales were again excluded from the analyses and are presented in Table 3 and Supplementary material online. To aid transparency of the covariates and analyses methods utilized by the individual studies, multivariate data were also analysed using synthesis without meta-analysis SWiM.19
Summary of studies that included multivariate data
| Study | Outcome | ConHD and CRF factor | Unit | Univariate HR (95% CI) | Multivariate HR (95% CI) | Univariate P | Multivariate P | Method | Covariates considered for adjustment in the multivariate model | Final covariates included in the multivariate model | ROB |
|---|---|---|---|---|---|---|---|---|---|---|---|
| # Radojevic 2013 | Death, non-elective hospitalization, and surgical repair | Ebstein HRR | Increase of >25 b·min−1 | 3.07 (1.24–7.61) | NR | 0.016 | NS | Stepwise forward | Peak O2 | = | Moderate |
| # Radojevic 2013 | Death, non-elective hospitalization, and surgical repair | Ebstein peak O2 | <60% predicted | 3.47 (1.28–9.44) | NR | 0.015 | 0.009 | Stepwise forward | HRR | = | Moderate |
| Egbe 2017 | 5-year cardiovascular adverse event | Fontan change in peak VO2 | −3 percentage points/year | 3.41 (2.86–4.31) | 1.86 (1.11–0.48) | 0.003 | 0.02 | Multivariate (all significant univariate included) | Atriopulmonary Fontan | = | Moderate |
| Cunningham 2017 | Death, cardiac transplant, or non-elective hospitalization for heart failure | Fontan change in peak O2 | Per 10% decline | 1.4 (1–1.8) | 1.4 (1–1.9) | 0.05 | 0.04 | Bivariate | Change in NYHA FC | = | Moderate |
| # Nathan 2015 | Death, transplantation, or non-elective cardiovascular hospitalization | Fontan EOV | Y/N | 1.8 (1.1–3) | 2 (1.2–3.6) | 0.01 | 0.01 | Multivariate | Age, NYHA, VE/VCO2 slope, % predicted FVC, Peak O2, % predicted HR | = | Moderate |
| # Fernandes 2011 | All-cause mortality | Fontan GET | <9.0 mL·kg−1·min−1 | 5.5 (2.1–14.8) | NR | 0.0006 | 0.02 | Bivariate | Age at CPET | = | Moderate |
| Diller 2010 | Death or heart transplantation | Fontan HRR | Per 10 b·min−1 | 0.83 (0.71–0.96) | 0.97 (0.96–0.99) | 0.016 | 0.01 | Bivariate | Age | = | Moderate |
| # Fernandes 2011 | All-cause mortality | Fontan O2 pulse | <97 (% predicted) | 2.7 (0.4–20.6) | NR | 0.33 | 0.44 | Bivariate | Age at CPET | = | Moderate |
| # Fernandes 2011 | All-cause mortality | Fontan O2 saturation at peak exercise | <81.5% | 3.3 (1–10.5) | NR | 0.04 | 0.07 | Bivariate | Age at CPET | = | Moderate |
| # Chen 2014 | Cardiac morbidity (cardiac-related hospitalization—heart failure, arrhythmia, protein losing enteropathy) | Fontan OUES | ≤45% predicted | 7.64 (2.31–25.23) | 5.25 (1.43–19.33) | 0.001 | 0.013 | Bivariate | Resting O2 saturation | = | Moderate |
| # Fernandes 2011 | All-cause mortality, new morbidity (unplanned CV hospitalization, heart failure, thrombosis, protein-losing enteropathy) | Fontan peak HR | <122.5 b·min−1 | 10.6 (3–37.1) | NR | 0.0002 | 0.001 | Bivariate | Age at CPET | = | Moderate |
| Nathan 2015 | Death, transplant, or incident non-elective hospitalization for cardiovascular or Fontan-related events | Fontan peak HR | Per 10% | NR | 0.77 (0.62–0.95) | <0.05 | 0.01 | Multivariate | Age, NYHA, VE/VCO2 slope, % predicted FVC, Peak VO2, % predicted HR | = | Moderate |
| Ohuchi 2014 (2) | Unscheduled hospitalization | Fontan peak HR | Per 10 b·min−1 | 0.73 (0.63–0.86) | NR | 0.0002 | NS | Multivariate (all significant univariate included) | Non-LV systemic ventricle, heterotaxy syndrome, protein PLE, CVP, arterial O2 saturation, VE/VCO2, peak VO2, BNP, renin, Na, albumin, GGT, HOMA-IR | Heterotaxy, CVP, peak VO2, albumin, HOMA-IR | Moderate |
| Ohuchi 2014 (1) | Unscheduled hospitalization | Fontan peak HR | Per 10 b·min−1 | 0.78 (0.69–0.88) | NR | 0.0001 | NS | Multivariate (all significant univariate included) | Age, gender, age at Fontan, PLE, CVP, EDVI, AVVR grade, blood urea nitrogen, creatinine, VE/VCO2, peak O2, vital capacity, BNP, norepinephrine, renin, Na, albumin, HOMA-IR | Age, BNP, PRA | Moderate |
| # Fernandes 2011 | All-cause mortality, new morbidity (unplanned CV hospitalization, heart failure, thrombosis, protein-losing enteropathy) | Fontan peak O2 | <18.9 mL·kg−1·min−1 | 2.38 (1.44–3.95) | 1.95 (1.14–3.36) | 0.001 | 0.02 | Multivariate | Age at Fontan, Age at CPET, Time from Fontan to CPET, VE/VCO2 slope | = | Moderate |
| Ohuchi 2014 (2) | Unscheduled hospitalization | Fontan peak O2 | Per 5% | 0.55 (0.44–0.7) | 0.55 (0.31–0.88) | <0.0001 | 0.0109 | Multivariate (all significant univariate included) | Non-LV systemic ventricle, heterotaxy syndrome, protein PLE, CVP, arterial O2 saturation, VE/VCO2, peak HR, BNP, renin, Na, albumin, GGT, HOMA-IR | Heterotaxy, CVP, peak VO2, albumin, HOMA-IR | Moderate |
| Ohuchi 2014 (1) | Unscheduled hospitalization | Fontan peak O2 | Per 5% | 0.65 (0.55–0.76) | NR | <0.0001 | NS | Multivariate (all significant univariate included) | Age, gender, age at Fontan, PLE, CVP, EDVI, AVVR grade, blood urea nitrogen, creatinine, VE/VCO2, peak HR, vital capacity, BNP, norepinephrine, renin, Na, albumin, HOMA-IR | Age, BNP, PRA | Moderate |
| Sieweke 2019 | Death or heart failure event | Fontan peak O2 | % predicted | 0.92 (0.87–0.98) | NR | 0.012 | NS | Multivariate | EF, BNP, cardiac index, contractility, afterload | = | Moderate |
| # Fernandes 2011 | All-cause mortality | Fontan peak O2 | <16.6 mL·kg−1·min−1 | 7.5 (2.6–21.6) | NR | 0.0002 | 0.005 | Bivariate | Age at CPET | = | Moderate |
| Inai 2005 | Arrhythmia, thromboembolism, heart-failure, sudden death, and protein-losing enterocolitis | Fontan peak O2 | NR | 1.18 (NR) | 1.21 (NR) | 0.035 | 0.076 | Multivariate | LVEF, ANP, BNP, NE, Ang-I, Ang-II, Plasma renin activity, Aldosterone, ET-1 | = | Moderate |
| Nathan 2015 | Death, transplant, or incident non-elective hospitalization for cardiovascular or Fontan-related events | Fontan peak O2 | Per 10% | NR | NR | <0.05 | NS | Multivariate | Age, NYHA, VE/VCO2 slope, % predicted FVC, peak O2, % predicted HR | = | Moderate |
| Egbe 2017 | 5-year cardiovascular adverse event | Fontan peak O2 | Per 5% | 2.16 (1.33–3.94) | 1.77 (0.33–3.76) | 0.02 | 0.47 | Multivariate (all significant univariate included) | Age, atriopulmonary Fontan, atrial arrhythmia, NYHA | = | Moderate |
| # Fernandes 2011 | All-cause mortality | Fontan VE/VCO2 slope | >35.5 | 2.84 (1.02–7.87) | NR | 0.04 | 0.04 | Bivariate | Age at CPET | = | Moderate |
| Chen 2014 | Cardiac morbidity (cardiac-related hospitalization—heart failure, arrhythmia, protein losing enteropathy) | Fontan VE/VCO2 slope | ≥37 | 10.77 (1.37–84.25) | 3.42 (0.31–37.7) | 0.023 | 0.316 | Bivariate | Heart failure and/or PLE | = | Moderate |
| Ohuchi 2014 (2) | Unscheduled hospitalization | Fontan VE/VCO2 slope | Per 1 | 1.14 (1.06–1.21) | NR | 0.0002 | NS | Multivariate (all significant univariate included) | Non-LV systemic ventricle, heterotaxy syndrome, protein PLE, CVP, arterial O2 saturation, peak VO2, peak HR, BNP, renin, Na, albumin, GGT, HOMA-IR | Heterotaxy, CVP, peak VO2, albumin, HOMA-IR | Moderate |
| Ohuchi 2014 (1) | Unscheduled hospitalization | Fontan VE/VCO2 slope | Per 1 | 1.08 (1.04–1.12) | NR | 0.0001 | NS | Multivariate (all significant univariate included) | Age, gender, age at Fontan, PLE, CVP, EDVI, AVVR grade, blood urea nitrogen, Creatinine, peak HR, peak VO2, vital capacity, BNP, norepinephrine, renin, Na, albumin, HOMA-IR | Age, BNP, PRA | Moderate |
| Inuzuka 2012 | All-cause mortality | Mix fall in O2 saturation during exercise | Per 5% decrease | 2.9 (2.01–4.18) | NR | 0.001 | NS | Multivariate stepwise forward | Peak RER, peak VO2, HRR, GET, VE/VCO2 slope, age, resting O2 saturation | = | Moderate |
| Inuzuka 2012 | All-cause mortality | Mix GET | NR | 0.86 (0.83–0.9) | NR | 0.001 | NS | Multivariate stepwise forward | Peak RER, peak VO2, HRR, O2 saturations during exercise, VE/VCO2 slope, age, resting O2 saturation | = | Moderate |
| Diller 2006 | All-cause mortality | Mix HRR | Per 10 b·min−1 | 0.75 (0.67–0.84) | 0.86 (0.74–0.99) | 0.0001 | 0.04 | Multivariate stepwise forward | Antiarrhythmic therapy, NYHA, peak VO2 | = | Moderate |
| Inuzuka 2012 | All-cause mortality | Mix HRR | Per 10 b·min−1 | 0.75 (0.69–0.82) | 0.85 (0.77–0.94) | 0.001 | 0.001 | Multivariate stepwise forward | Peak RER, GET, peak VO2, VE/VCO2 slope, O2 saturations during exercise, age, resting O2 saturation | = | Moderate |
| Giardini 2007 | All-cause mortality | Mix HRR | HRR | 0.83 (0.74–0.9) | NR | 0.0001 | NS | Multivariate (backward method) | Peak VO2, VE/VCO2 slope, peak circulatory power, NYHA, antiarrhythmic therapy | VE/VCO2 slope, peak circulatory power | Moderate |
| Diller 2019 | All-cause mortality | Mix peak HR | b·min−1 | 0.97 (0.96–0.97) | 0.99 (0.98–0.99) | <0.001 | 0.009 | Multivariate | Age, gender, ECG parameters, laboratory parameters, peak VO2, peak SBP | = | Low |
| Dimopoulous 2006 | Mortality | Mix peak HR | b·min−1 | 0.98 (0.96–0.99) | NR | <0.05 | NS | Multivariate stepwise forward | VE/VCO2 slope, Peak HR | = | Moderate |
| Diller 2019 | All-cause mortality | Mix peak SBP | mmHg | 0.98 (0.97–0.99) | 0.98 (0.97–0.99) | <0.001 | 0.001 | Multivariate | Age, gender, ECG parameters, peak HR, peak VO2, laboratory parameters | = | Low |
| Giardini 2007 | All-cause mortality | Mix peak VO2 | mL·kg−1·min−1 | 0.91 (0.84–0.93) | NR | 0.0001 | NS | Multivariate (backward method) | HRR, VE/VCO2 slope, peak circulatory power, NYHA, antiarrhythmic therapy | VE/VCO2 slope, peak circulatory power | Moderate |
| Inuzuka 2012 | All-cause mortality | Mix peak VO2 | Per 10% | 0.67 (0.61–0.73) | 0.78 (0.69–0.9) | 0.001 | 0.001 | Multivariate stepwise forward | Peak RER, GET, HRR, VE/VCO2 slope, O2 saturations during exercise, age, resting O2 saturation | = | Moderate |
| Brida 2017 | All-cause mortality | Mix peak VO2 | 100 mL/min | 0.85 (0.83–0.88) | 0.90 (0.87–0.94) | <0.0001 | 0.0001 | Multivariate | Age, complexity moderate, complexity severe, cyanosis, NYHA class 2, NYHA class 3, NYHA class 4, Body mass index | = | Low |
| Diller 2006 | All-cause mortality | Mix peak VO2 | mL·kg−1·min−1 | 0.9 (0.86–0.94) | NR | 0.0001 | NS | Multivariate stepwise forward | HRR, antiarrhythmic therapy, NYHA | = | Moderate |
| Diller 2019 | All-cause mortality | Mix peak VO2 | mL·kg−1·min−1 | 0.88 (0.85–0.90) | 0.91 (0.88–0.95) | <0.001 | 0.001 | Multivariate | Age, gender, ECG parameters, peak HR, laboratory parameters, peak SBP | = | Low |
| Dimopoulous 2006 | Mortality | Mix peak VO2 | mL·kg−1·min−1 | 0.9 (0.83–0.96) | NR | <0.05 | NS | Multivariate stepwise forward | VE/VCO2 slope, Peak HR | = | Moderate |
| Giardini 2007 | All-cause mortality | Mix peak circulatory power | mmHg mLO2 min−1 kg−2 | 0.76 (0.67–0.84) | 0.96 (0.94–0.97) | 0.0001 | 0.0001 | Multivariate (backward method) | HRR, VE/VCO2 slope, peak VO2, NYHA, antiarrhythmic therapy | VE/VCO2 slope, peak circulatory power | Moderate |
| Inuzuka 2012 | All-cause mortality | Mix rest O2 saturation | Per 1% | 0.91 (0.89–0.93) | 0.96 (0.93–0.99) | 0.001 | 0.009 | Multivariate stepwise forward | Peak RER, GET, peak VO2, VE/VCO2 slope, HRR, age, O2 saturations during exercise | = | Moderate |
| Dimopoulous 2006 | All-cause mortality | Mix VE/VCO2 slope | Per 1 | 1.07 (1.03–1.11) | 1.076 (1.04–1.12) | <0.05 | <0.05 | Multivariate stepwise forward | Peak VO2, peak HR | = | Moderate |
| Giardini 2007 | All-cause mortality | Mix VE/VCO2 slope | NR | 1.12 (1.08–1.18) | 1.17 (1.1–1.24) | 0.0001 | 0.0001 | Multivariate (backward method) | HRR, peak circulatory power, peak VO2, NYHA, antiarrhythmic therapy | VE/VCO2 slope, peak circulatory power | Moderate |
| Inuzuka 2012 | All-cause mortality | Mix VE/VCO2 slope | VE/VCO2 slope | 1.02 (1.02–1.03) | NR | 0.001 | NS | Multivariate stepwise forward | Peak RER, GET, peak VO2, HRR, O2 saturations during exercise, age, resting O2 saturation | = | Moderate |
| Rydman 2015 | New sustained tachyarrhythmia or heart failure hospital admission/transplantation/death | TGA HRR | b·min−1 | 0.98 (0.96–0.99) | 0.99 (0.97–1.01) | 0.037 | 0.419 | Bivariate | RV late gadolinium enhancement present | = | Moderate |
| Giardini 2009 | All-cause mortality and emergency cardiac-related hospital admission | TGA HRR | NR | 0.034 (0.01–0.14) | NR | 0.0001 | NS | Multivariate | Peak VO2, pacemaker, age at CPET, VE/VCO2 slope, Senning operation | VE/VCO2 slope, Peak VO2. | Low |
| Van Der Bom 2013 | Death; ventricular tachycardia; vascular events; tricuspid regurgitation requiring invasive treatment; worsening heart failure; supraventricular bradyarrhythmia or tachyarrhythmia requiring cardioversion, ablation, pacemaker, or a permanent change of medication | TGA peak SBP | mmHg | 0.78 (NR) | 0.86 (NR) | 0.002 | 0.02 | Other multivariate | NYHA, ECG (sinus rhythm), Holter (premature ventricular complex), RVEDVi via MRI and echocardiography | RVEDVi (MRI), RVEDVi (Echo) | Low |
| Giardini 2009 | All-cause mortality and emergency cardiac-related hospital admission | TGA peak VO2 | % predicted | 0.96 (0.95–0.97) | 0.98 (0.96–0.99) | 0.0001 | 0.0136 | Multivariate | VE/VCO2 slope, pacemaker, age at CPET, HRR, Senning operation | VE/VCO2 slope, Peak VO2 | Low |
| Rydman 2015 | New sustained tachyarrhythmia or heart failure hospital admission/transplantation/death | TGA peak VO2 | Per 5 mL·kg−1·min−1 | 0.56 (0.35–0.89) | 0.59 (0.35–1.01) | 0.016 | 0.057 | Bivariate | RV late gadolinium enhancement present | = | Moderate |
| Giardini 2009 | All-cause mortality and emergency cardiac-related hospital admission | TGA VE/VCO2 slope | VE/VCO2 slope | 1.09 (1.07–1.10) | 1.08 (1.06–1.11) | 0.0001 | 0.0001 | Multivariate | Peak VO2, pacemaker, age at CPET, HRR, Senning operation | VE/VCO2 slope, Peak VO2 | Low |
| Tsai 2016 | Two-year cardiac-related hospitalization | ToF GET | mL·kg−1·min−1 | 0.18 (NR) | NR | 0.023 | NS | Multivariate | Peak VO2, moderate/severe PR, OUES/BSA | = | Moderate |
| Valente 2014 | All-cause mortality, aborted sudden cardiac death, or sustained VT | ToF GET | Per 5 % predicted decrease | 1.37 (0.81–2.31) | NR | 0.25 | NS | Multivariate stepwise forward | Age at repair, age at CMR, TOF with PA, prior systemic-pulmonary artery shunt, RV-to-PA conduit, atrial arrhythmia, QRS duration, % predicted peak watts, peak VO2, RV EF, RV mass index (g/m2), RV mass (z score), RV mass/volume, LVESV, LV EF, LV mass index (g/m2), LV mass/volume | RV mass/volume ratio, LV EF/RV EF, atrial arrhythmia | Low |
| # Tsai 2016 | Two-year cardiac-related hospitalization | ToF OUES | <1.029 (OUES/BSA) | 4.14 (NR) | 4.60 (NR) | 0.013 | 0.031 | Multivariate | Peak VO2, moderate/severe PR, GET | = | Moderate |
| Giardini 2007b | Cardiac-related mortality and hospitalization | ToF peak HR | b·min−1 | 0.98 (0.96–0.99) | 1.07 (NR) | 0.001 | NS | Multivariate stepwise forward | RV systolic function, pulmonary regurgitation, RV systolic pressure, NYHA, peak VO2, VE/VCO2 slope | NYHA, VE/VCO2 slope, peak VO2 | Low |
| Giardini 2007b | Cardiac-related mortality and hospitalization | ToF peak VO2 | % predicted | 0.96 (0.93–0.99) | 0.97 (0.95–0.99) | 0.001 | 0.01 | Multivariate stepwise forward | RV systolic function, pulmonary regurgitation, RV systolic pressure, Peak HR, NYHA, VE/VCO2 slope | NYHA, VE/VCO2 slope | Low |
| Muller 2015 | Death or cardiac-related hospitalization | ToF peak VO2 | % predicted | NR | 0.98 (0.97–0.99) | NR | 0.001 | Multivariate | VE/VCO2 slope, age, QRS duration | = | Low |
| # Tsai 2016 | Two-year cardiac-related hospitalization | ToF peak VO2 | <74% | 9.93 (NR) | 20.07 (NR) | 0.026 | 0.011 | Multivariate | OUES/BSA, moderate/severe pulmonary regurgitation, GET | = | Moderate |
| Buys 2012 | Death or cardiac-related hospitalization | ToF peak VO2 | mL·kg−1·min−1 | NR | 0.96 (0.92–0.99) | NR | 0.029 | Multivariate | Age at correction, age at CPET, RV function, QRS duration, VE/VCO2 slope | = | Low |
| Valente 2014 | All-cause mortality, aborted sudden cardiac death, or sustained VT | ToF peak VO2 | Per 5 % predicted decrease | 1.2 (1.01–1.43) | NR | 0.03 | NS | Multivariate stepwise forward | Age at repair, age at cardiac MR, TOF with PA, prior systemic-pulmonary artery shunt, RV-to-PA conduit, atrial arrhythmia, QRS duration, % predicted peak watts, GET, RV EF, RV mass index (g/m2), RV mass (z score), RV mass/volume, LVESV, LV EF, LV mass index (g/m2), LV mass/volume | RV mass/volume ratio, LV EF/RV EF, atrial arrhythmia | Low |
| Valente 2014 | All-cause mortality, aborted sudden cardiac death, or sustained VT | ToF peak watts | Per 5-unit decrease | 1.28 (1.05–1.56) | NR | 0.02 | NS | Multivariate stepwise forward | Age at repair, age at cardiac magnetic resonance imaging, ToF with PA, prior systemic-pulmonary artery shunt, RV-to-PA conduit, atrial arrhythmia, QRS duration, VO2 at the GET, peak VO2, RV EF, RV mass index (g/m2), RV mass (z score), RV mass/volume, LV end systolic volume, LV EF, LV mass index (g/m2), LV mass/volume | RV mass/volume ratio, LV EF/RV EF, atrial arrhythmia | Low |
| Buys 2012 | Death or cardiac-related hospitalization | ToF VE/VCO2 slope | VE/VCO2 slope | NR | 1.13 (1.02–1.26) | NR | 0.021 | Multivariate | Age at correction, age at CPET, RV function, QRS duration, Peak VO2 | = | Low |
| Muller 2015 | Death or cardiac-related hospitalization | ToF VE/VCO2 slope | VE/VCO2 slope | NR | 1.03 (1.02–1.05) | NR | 0.001 | Multivariate | Peak VO2, age, QRS duration | = | Low |
| Giardini 2007b | Cardiac-related mortality and hospitalization | ToF VE/VCO2 slope | VE/VCO2 slope | 1.09 (1.05–1.15) | 1.08 (1.04–1.11) | 0.001 | 0.002 | Multivariate stepwise forward | RV systolic function, pulmonary regurgitation, RV systolic pressure, Peak HR, NYHA, Peak VO2 | NYHA, Peak VO2 | Low |
indicates studies that were not pooled into the secondary analysis as they calculated HR from dichotomous patient data; grey areas indicate non-significant associations in the final model (P > 0.05); Ohuchi 2014 (1), adults; Ohuchi 2014 (2), paediatrics; Giardini 2007b, Tetralogy of Fallot patients.
BNP, brain natriuretic peptide; BSA, body surface area; CVP, central venous pressure; EDVI, end-diastolic volume indexed; EF, ejection fraction; EOV, exercise oscillatory volume; ESV, end-systolic volume; FVC, forced vital capacity; GGT, gamma-glutamyl transferase; HOMA-IR, homeostatic model assessment- insulin resistance; HRR, heart rate reserve; LV, left ventricle; MET, metabolic equivalent task; Mix, mixture of ConHD populations; NR, not reported; NS, non-significant association but numerical value not reported; NYHA, New York Heart Association; O2, oxygen; OUES, oxygen uptake efficiency slope; Peak HR, peak heart rate; Peak O2, peak oxygen consumption; PET CO2, partial pressure of end tidal carbon dioxide; PLE, protein losing enteropathy; RER, respiratory exchange ratio; RV, right ventricle; SBP, systolic blood pressure; TGA, transposition of the great arteries (systemic right ventricle); ToF, Tetralogy of Fallot; VC, vital capacity; E/CO2 slope, ventilatory equivalent for carbon dioxide; VO2 at the GET, oxygen consumption at the gas exchange threshold.
A separate meta-analysis for each CPET parameter with the ConHD diagnoses entered as a subgroup can be found in Supplementary material online. Due to the different scales being reported (i.e. % predicted, mL·kg−1·min−1) a second subgroup analysis was produced, and small study effects were investigated using funnel plots when ≥10 studies were present. Results are reported as mean and standard deviations or mean and 95% CIs. All analyses were conducted using Stata/SE 16.0 (StataCorp LLC, USA), and the syntax can be found in the Supplementary material online.
Results
Study selection
Following deduplication, database searches produced 4420 references. Following screening, 212 full-text articles were assessed for eligibility, with 48 studies included (Figure 1).
Characteristics of included studies
Of the 48 studies, 34 provided data that allowed them to be meta-analysed.20–53 The remaining 14 studies were analysed using SWiM.54–67 For further information on studies that were analysed using only SWiM, see the subheading ‘SWiM summary’ and Supplementary material online.
SWiM summary
Of the 14 studies that were not pooled into meta-analysis: 9 were not pooled as they used other statistical methods, 1 did not report numeric HR associations, 2 assessed CPET trajectory or did not use a CPET parameter as an index prognostic factor, and 2 were pre-operative/transplant evaluation. Therefore, pooling would not yield interpretable results. The results reported by these studies were not different to the meta-analysed data reported by the current review, see Supplementary material online. The following sections detail studies that were entered into meta-analysis only.
Participants
All available patients with structural ConHD were included. Six ConHD populations were identified, with adult data reported in 32 studies/arms and paediatric data (<18 years of age) were reported in 3 studies/arms.39,44,50
Index prognostic factors
Table 2 reports the CPET parameters included within meta-analysis. All studies performed the CPET during routine care within a hospital setting. Studies performed CPETs using either a cycle ergometer (n = 16), a treadmill (n = 24), a combination of cycle or treadmill ergometers (n = 5),26,29,45,51,66 or did not explicitly report their exercise modality (n = 3) (see Supplementary material online). Exercise protocols included the Bruce, modified Bruce, Naughton, step, or ramp. No study confirmed a plateau of oxygen consumption or performed a supramaximal exercise bout to confirm a maximal effort; instead, they used secondary criteria such as respiratory exchange ratio (RER) with a range of cut-offs to validate a maximal test.
CPET parameters in meta-analysis
| CPET parameters | All studies | No. of patients |
|---|---|---|
| Peak O2 | 32 | 20 372 |
| E/CO2 slope | 19 | 17 548 |
| Peak heart rate | 11 | 12 504 |
| HRR | 9 | 3433 |
| O2 at the GET | 8 | 2850 |
| Peak SBP | 5 | 10 442 |
| Peak power output | 4 | 954 |
| Peak O2 pulse | 3 | 421 |
| Chronotropic index | 2 | 867 |
| Heart rate recovery | 2 | 771 |
| NYHA | 2 | 1159 |
| OUES | 2 | 92 |
| Change in peak O2 over time | 2 | 201 |
| EOV | 1 | 253 |
| Exercise-induced arrhythmia and ischaemia | 1 | 138 |
| Peak MET | 1 | 51 |
| Peak PET CO2 | 1 | 44 |
| Change in CPET variables over time | 1 | 130 |
See Supplementary material online for individual study data including names, effects, and units (i.e. peak O2 was reported in mL·kg−1·min−1, %predicted, and dichotomous cut-offs).
EOV, exercise oscillatory volume; HRR, heart rate reserve; MET, metabolic equivalent task; NYHA, New York Heart Association; O2, oxygen; OUES, oxygen uptake efficiency slope; Peak HR, peak heart rate; Peak O2, peak oxygen consumption; PET CO2, partial pressure of end tidal carbon dioxide; SBP, systolic blood pressure; E/CO2 slope, ventilatory equivalent for carbon dioxide; VO2 at the GET, oxygen consumption at the gas exchange threshold.
Comparator prognostic factors
Table 3 presents the characteristics of included studies and the various covariates that were considered compared to those that were entered in the final multivariate models. Common covariates were age, sex, electrocardiogram parameters, other CPET variables, and cardiac structure/function. However, it was uncommon for studies to adjust for the same covariates and/or use the same analysis methods: for example, Ohuchi39 and Egbe24 both report peak O2 on the same scale (per 5% predicted) in people with Fontan circulations. However, Ohuchi39 controls for three covariates (age, brain natriuretic peptides, renin activity) and Egbe24 four covariates, three of which are different (age, atriopulmonary Fontan, atrial arrhythmia, New York Heart Association).
Outcome
All studies pooled into meta-analysis had either a composite MACE outcome, or an outcome that is considered a MACE component (i.e. all-cause mortality, death or cardiac transplantation, unscheduled hospitalization for a cardiac cause, etc.). The median length of follow-up was 47 months (range 20–163 months).
Risk of bias
Risk of Bias judgements can be located in-text, in Figure 2 and in the Supplementary material online. For all studies, the overall RoB was low in 12 studies (25%), moderate in 31 (65%), and high in 5 (10%) studies. Of the 34 studies included in the meta-analysis, 10 (29%), 23 (68%), and 1 (2%) were considered low, medium, and high RoB, respectively (Figure 2). For studies to be considered as a low risk of bias they must have received a low grading in five out of the six QUIPS domains and reported: a detailed description of their cohort, prospective studies with registered protocols, no evidence of selection bias, low levels of study attrition, well-described CPET protocols, followed up patients in multiple ways (i.e. office for national statistics, hospital records and contacted patients), report/adjusted for comparator prognostic factors and had appropriate statistical analyses.
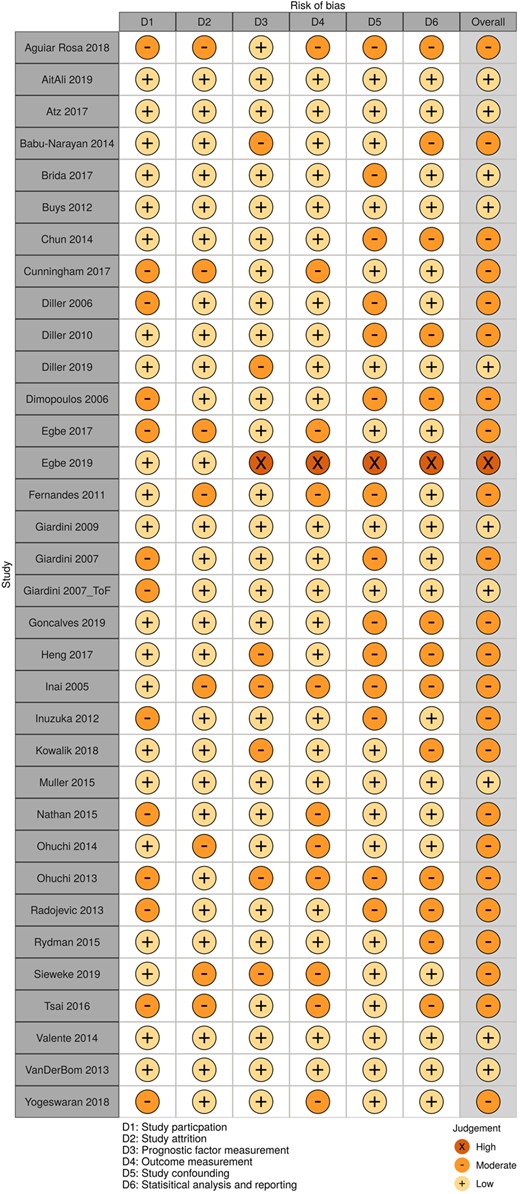
Risk of bias of studies included within a meta-analysis.
Primary univariate analysis
The primary analysis (Figure 3) pooled univariate HR associations, from two or more studies, that reported the same ConHD diagnosis and CPET parameter combination. Data that were calculated from dichotomous CPET data were analysed separately.
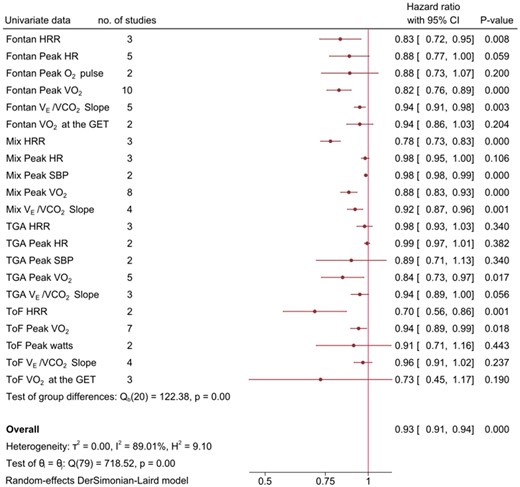
Primary meta-analysis of univariate HR associations between ConHD/CPET parameters and MACE. GET, gas exchange threshold; HRR, heart rate reserve; Mix, mixture of ConHD populations; O2, oxygen; Peak HR, peak heart rate; SBP, systolic blood pressure; TGA, transposition of the great arteries; ToF, Tetralogy of Fallot; E/CO2 slope, ventilatory equivalent for carbon dioxide.
The primary analysis contained 21 ConHD/CPET combinations, 10 were statistically significant with HR ranging from 0.70 to 0.98 (Figure 3). Peak O2 was inversely associated with MACE in all ConHD subtypes, with an 18% reduction in Fontan circulation (95% CI 0.76–0.89; 10 studies), a 12% reduction in a mixed ConHD cohort (95% CI 0.83–0.93; 8 studies), a 16% reduction in transposition of the great arteries (TGAs) (systemic right ventricle, post-Senning/Mustard procedure) (95% CI 0.73–0.97; 5 studies), and a 6% reduction in ToF (0.89–0.99; 7 studies). To summarize results on other ConHD/CPET combinations in Figure 3: HRR was inversely associated with MACE in three out of four ConHD groups (HR range 0.7–0.98), lower values of the E/CO2 slope were directly associated with a lower risk of MACE in two out of four ConHD groups (HR range 0.92–0.96), peak systolic blood pressure was associated to MACE in a mixed cohort (HR 0.98) but not TGA, but peak O2 pulse, peak HR, and O2 at the GET were not associated to MACE in any ConHD group.
The overall pooled HR was 0.93 (95% CI 0.91–0.94). Two sensitivity analyses were performed: the removal of paediatric data (HR 0.93, 95% CI 0.92–0.94),39,44 and the removal of studies reporting mixed exercise modalities in the patient cohort or did not explicitly report the exercise modality used (HR 0.91, 95% CI 0.89–0.93).22,25,29,45,51
Secondary multivariate analysis
All studies that reported multivariate data from CPET parameters on a continuous scale were pooled into a secondary analysis to provide a head-to-head comparison (Figure 4). The primary univariate analysis included 80 ConHD/CPET combinations, the secondary analysis included 37, as fewer studies performed multivariate analysis (Figure 4). Where the number of studies is fewer on the multivariate analysis (right-hand plot), this is due to studies not reporting the final numeric HR statistics. Where the number of studies in the multivariate analysis is greater than the univariate analysis (left-hand plot, ToF peak O2 and ToF E/CO2 slope) this is because two studies report multivariate data only.36,49
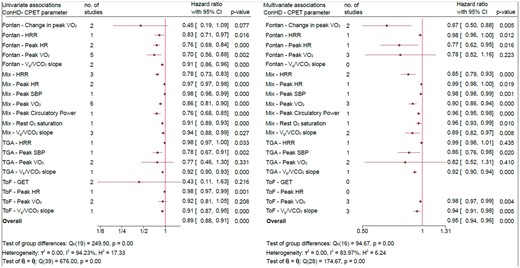
Secondary analysis: side by side comparison of univariate HR vs. multivariate HR. GET, gas exchange threshold; HRR, heart rate reserve; Mix, mixture of ConHD populations; O2, oxygen; Peak HR, peak heart rate; SBP, systolic blood pressure; TGA, transposition of the great arteries; ToF, Tetralogy of Fallot; E/CO2 slope, ventilatory equivalent for carbon dioxide.
To aid transparency, Table 3 shows a summary of the multivariate data reported by the studies, it includes the univariate vs. multivariate HR (95% CI) covariates that studies considered for inclusion in multivariate models (i.e. ones that were significant at a univariate level), actual covariates in the final multivariate model, the analysis method undertaken, and the RoB of that study.
Table 3 presents 63 significant univariate associations, once these index CPET parameters had been included in multivariate analyses, 35 (55%) associations remained significant predictors of MACE.
Adverse events during cardiopulmonary exercise testing
Forty-four (92%) studies did not explicitly report the secondary outcome of serious adverse events during CPET. Of the four (8%) studies that did contribute data, no study reported a serious adverse event or death. However, Buys et al.49 did report ST-segment depression at peak exercise in one participant with repaired ToF.
Discussion
The current review included 48 studies (34 meta-analysed) assessing the associations between CPET-derived CRF outcomes and MACE in patients with ConHD. These findings support the hypothesis that CRF is a prognostic factor for mortality and morbidity in ConHD. The primary univariate meta-analysis reports that higher values of several CRF parameters (e.g., peak O2, and HRR) and lower values of the E/CO2 slope were consistently associated with reduced risk of MACE. Although the strength of this association was reduced following adjustment (e.g. age, gender), pooled models of multivariate estimates remained statistically significant. Of the four studies that explicitly reported serious adverse event data during a CPET, no events were reported.
The most reported CPET variable was peak O2 (32 studies), the most common unit of measure was mL·kg−1·min−1 followed by percent-predicted. Although less commonly reported, higher levels of submaximal outcomes were also associated to a reduced risk of MACE, showing a wide range of CPET-derived parameters may have prognostic utility in ConHD. These findings support the European Society of Cardiology and American College of Cardiology recommendations on the use of CPET in routine care for ConHD patients.3,68
Agreements and disagreements with other studies or reviews
This is the first systematic review and meta-analysis on the prognostic associations between CRF in MACE in all types of ConHD. Udholm et al.9 reported that the decline in peak O2 over time and the presence of EOV were the strongest predictors of outcome, but only in Fontan patients. The current review supports this conclusion, but also reports that a peak O2 collected during routine care is independently prognostic of outcomes in Fontan patients.
Randomized controlled trials (RCTs) using exercise training have a likely beneficial effect increasing both peak and submaximal indices of CRF in people with ConHD. Peak O2 has been reported to increase by a mean difference (MD) of 2.74 mL·kg−1·min−1 (95% CI 0.36–5.12) and O2 at the GET by a MD of 2.05 (95% CI 0.05–4.05).11,69 Further RCTs should utilize a long-term follow-up to see if these increases in measures of CRF are sustained and prognostically important.
Study considerations
There can be considerable clinical diversity between ConHD conditions (i.e. lesion-specific diagnoses) and within a single ConHD subtype.6,70 This review has performed subgroup analysis to help explain the between condition heterogeneity. The authors would recommend not to interpret the overall pooled estimate from the meta-analysis due to the between ConHD/CPET group heterogeneity, but instead to interpret the subgroup values (i.e. HR and 95% CI for peak O2 in Fontan). Unfortunately, due to the variability in reporting, it is not possible to control for the within condition variability. To help reduce the within condition heterogeneity, future studies could consider a functional classification alongside a lesion-specific classification71,72 or to address this research question further perform an individual patient data meta-analysis.73
Another potential bias is the composite outcome MACE, as certain CPET parameters may predict one element of the composite outcome but not others. However, using MACE allowed the current review to pool multiple patient-important outcomes.
Most studies (65%) were judged as a moderate risk of bias. Future studies are encouraged to prospectively register their protocol. Moreover, studies should aim to improve their description of the patient cohort, study attrition, CPET interpretation, and patient follow-up. The funnel plots show asymmetry, which could indicate small study effects/reporting bias. However, it is too challenging to disentangle potential publication bias from the substantial heterogeneity present, which is a known issue with prognostic factors research.10
Conclusion
Cardiorespiratory fitness measured by CPET appears to be associated with future MACE in people with ConHD. However, given the moderate quality of included studies there is currently insufficient evidence to definitively determine the prognostic influence of CRF. Although data are limited (four studies), CPET appears safe with no study reporting a serious adverse event. No CPET protocol directly measured myocardial function during exercise, which may hold further prognostic benefit, and only 1% of the population was paediatric (age < 18 years). Further prospective prognostic cohort studies and RCTs utilizing exercise training with long durations of follow-up are warranted.
Implications for research and practice
We propose several suggestions to improve reporting. Firstly, at a minimum all studies should explicitly report any adverse events that occurred during CPET and follow the prognostic factor and prognostic modelling reporting frameworks (REMARK and TRIPOD).74,75 Furthermore, future research should aim to prospectively register their trials with transparent prognostic factors of interest. Studies should report the HR (or equivalent summary statistic) of all scales of the prognostic factor (i.e. % predicted, mL·kg−1·min−1) and avoid using summary statistics computed from dichotomous CPET data unless to answer a specific research question. To estimate the independent effect of CRF, studies should control for common covariates such as age at the test and resting oxygen saturations as a minimum. Lastly, there was an over reliance on secondary criteria (i.e. RER) to validate peak efforts, which likely confounds peak CPET results.76 Instead, if clinically appropriate and feasible, studies should confirm a plateau in oxygen consumption.
Differences between protocol and main review
Due to the lack of standardized reporting (i.e. units of measure, different covariates) and clinical heterogeneity meta-regression and Grading of Recommendations Assessment, Development and Evaluation was not attempted.
Second subgroup analysis of units of measure (i.e. %predicted vs. absolute).
Only the composite outcome of major adverse cardiovascular events was analysed.
The authors were not contacted to provide missing data.
Supplementary material
Supplementary material is available at European Journal of Preventive Cardiology online.
Data availability statement
Data will be shared on reasonable scientific request.
Funding
C.A.W. is funded by an industrial PhD scholarship by Canon Medical Systems UK Ltd. and the University of Exeter. M.E.W. is funded by a PhD scholarship from the QUEX institute. D.M.D. is supported by a doctoral scholarship (MR/N0137941/1) for the GW4 BIOMED DTP, awarded to the Universities of Bath, Bristol, Cardiff, and Exeter from the Medical Research Council (MRC)/UKRI. The funding bodies had no influence over the design or production of this manuscript.
Conflict of interest: none declared.
References
Author notes
Max E.Weston and Dan Mihai Dorobantu shared the second authorship and contributed equally to this work.

Comments