Abstract
Background: There are limited data on the association of membranous septum (MS) morphology and transcatheter heart valve (THV) implantation depth, and the development of new conduction abnormalities (CA) after transcatheter aortic valve implantation (TAVI).
Aims: The aim of this study was to describe the morphology of the MS and predict the risk of new CA after TAVI based on the MS morphology and THV implantation depth.
Methods: Based on preprocedural CT scans, the MS depth was measured for every 25% of the entire MS width in 272 TAVI patients without preprocedural bundle branch block (BBB) or pacemaker. Post-procedural CT scans for THV implantation depth assessment were available in 130 of these patients.
Results: The MS depth was a median of 2.5 mm (IQR 1.4-3.8) deeper at the posterior edge when compared to the anterior edge of the MS. New CA developed in 7.1% of patients in whom the THV did not cross the lower MS border at its anterior edge (3.6% with new BBB and high degree CA, respectively), in 18.8% of patients (15.6% with new BBB and 3.1% with new high-degree CA) where the THV overlapped the lower MS border by <2.5 mm and in 47.1% of patients (24.3% with new BBB and 22.9% with new high-degree CA) with THV overlap of the lower MS border by ≥2.5 mm.
Conclusions: The difference of the MS depth and THV implantation depth measured at the anterior edge of the MS predicted new CA after TAVI.
Introduction
New-onset conduction abnormalities (CA) involving the cardiac conductive tissue from the atrioventricular (AV) node to the bundle branches remain a frequent complication after transcatheter aortic valve implantation (TAVI). The potential clinical impact of CA, such as the need for permanent pacemaker (PPM) implantation, ventricular dysfunction and heart failure, is a particular concern with the expected expansion of TAVI to patients with longer life expectancy1.
The membranous interventricular septum (MS) is known to be an anatomical landmark visible by cardiac computed tomography (CT) scan2345 functioning as a surrogate for the distance between the native aortic annulus and the AV conduction system6789. The overlap with the lower border of the MS and the inflow portion of the transcatheter heart valve (THV) have been found to predict the risk of PPM implantation after TAVI with good accuracy in previous studies41011. The difference of the mean MS depth between patients with and without the need for PPM after TAVI is in the order of 1-2 mm. However, as the lower border of the MS does not run parallel with the native aortic annulus, there is a risk that the MS depth varies within the same patient depending on the location of measurement along the width of the MS. The optimal site of measuring the MS depth and corresponding variation of the THV implantation depth have not been reflected in previous studies.
The aim of this study was to describe the morphology of the MS along the entire width of the MS and evaluate the risk of new-onset CA after TAVI based on the MS depth and THV implantation depth measured by preprocedural and post-procedural CT scans.
Methods
This retrospective study included all consecutive patients without preprocedural bundle branch block (BBB) or pre-existing PPM treated with TAVI at two Danish sites from 2015 to 2018. Patients with bicuspid aortic valve, previous aortic valve replacement, who died within 30 days after TAVI were excluded. Contrast in the right ventricle is necessary for visualisation of the MS during a CT scan but was not routinely planned due to the retrospective nature of the study. Patients where the MS could not be visualised on the preprocedural CT scan were excluded. Baseline and follow-up data were collected from patient records. Preprocedural and post-procedural electrocardiogram (ECG) data were validated in all patients. The study was approved by the Danish Data Agency and Danish Patient Safety Authority.
Conduction abnormality
A QRS interval ≥120 ms was defined as BBB and further classified into left (LBBB) or right (RBBB) bundle branch block12. High-degree CA (HD-CA) was considered developed if a PPM was implanted due to 2° AV block type 2, 3° AV block or atrial fibrillation with bradycardia, based on class I/II indications for pacing in case of intermittent bradycardia13.
Patients were classified into either 1) no CA (absence of BBB on a 12-lead ECG taken closest to 30 days after TAVI and absence of HD-CA diagnosed within 30 days of TAVI), or 2) new CA including patients with 2a) new BBB (new-onset LBBB or RBBB on a 12-lead ECG taken closest to 30 days after TAVI) and 2b) new HD-CA (new-onset HD-CA within 30 days of TAVI regardless of the absence or presence of new BBB).
CT acquisition
Preprocedural CT scans were performed as part of routine TAVI preparation whereas patients with post-procedural CT scans had been randomly selected due to participation in a previous registry. Scans were performed using local protocols and contemporary single- or dual-source CT scanners with a minimum of 128 detector rows. All scans were ECG-gated with a slice thickness of 0.3-0.8 mm. CT data were analysed using 3mensio Structural Heart 9.1 (Pie Medical Imaging).
CT analysis
The analysis of CT data is described in Figure 1.
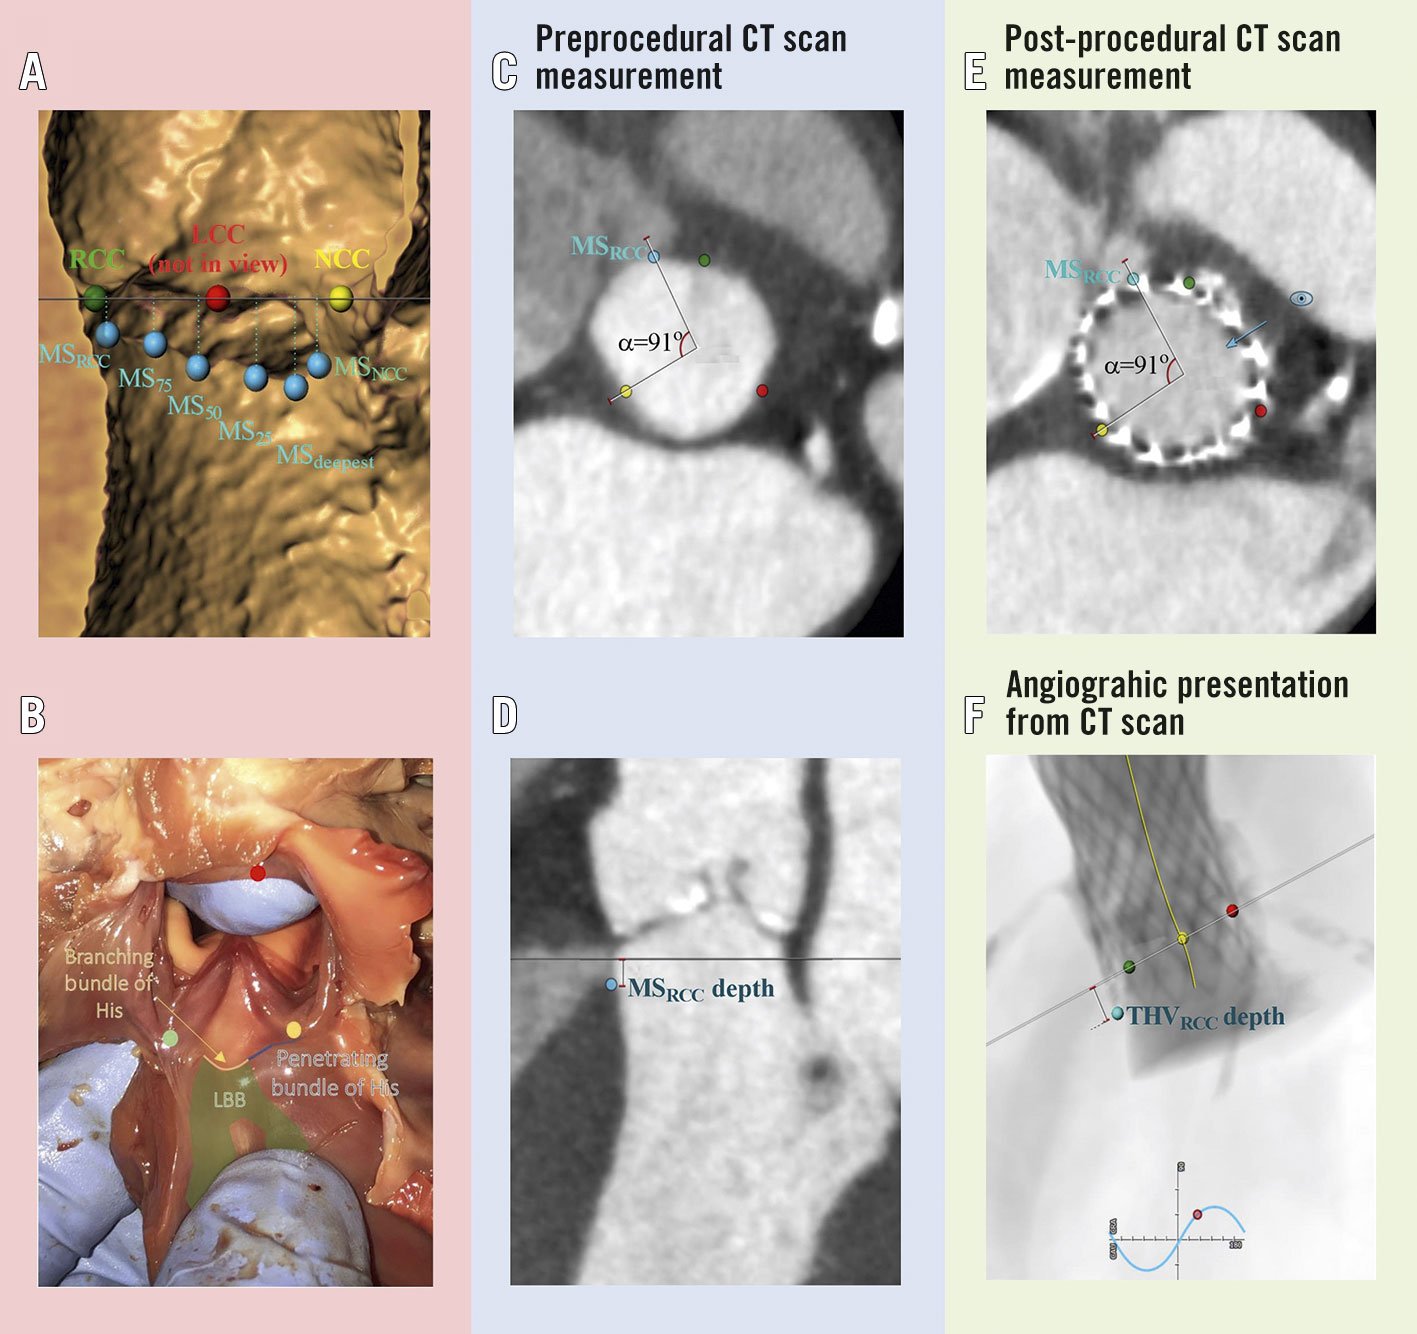
Figure 1. Measurement of the membranous septum depth and transcatheter heart valve implantation depth using preprocedural and post-procedural cardiac computed tomography (CT). The native aortic annulus was found as a virtual plane intersecting the nadir of the three native aortic cusps. The MS was visualised both in the aortic annular plane and in an orthogonal plane rotated around the centreline of the aortic annulus. A) & B) The MS (hollow structure in panel A, and pallid structure above the blue and yellow line in panel B) was divided into the different points of interest (blue dots), i.e., MSNCC - lower MS border closest to the NCC (yellow dot); MSRCC - lower MS border closest to the RCC (green dot); MS25, MS50 and MS75 - at 25%, 50% and 75% of the MS width from MSNCC to MSRCC, respectively; and MSdeepest (the MS at its deepest point). MS in coronal view (MSCV) is not shown in the Figure. Preprocedural CT analysis: C) Example of marking the location of the MSRCC in the aortic annular plane. Using the nadir of the NCC and centreline of the aortic annular plane as references the angle to the MSRCC was registered. D) Measurement of the MSRCC depth as the distance from the aortic annular plane to the lower MS border at MSRCC. Post-procedural CT analysis: E) Example of measuring the THVRCC implantation depth at MSRCC. The nadir of the native NCC and centreline of the native aortic annular plane on the post-procedural CT scan were again used as references, and the angle to the MSRCC registered from the preprocedural CT scan was used to mark the point of MSRCC on the post-procedural CT scan. The CT plane was moved so it would bisect the MSRCC. Then the C-arm positioning tool of the 3mensio Structural Heart 9.1 (Pie Medical Imaging) software was used, which brings the angiographic projection exactly perpendicular to the positioned plane that bisected the MSRCC (blue eye and arrow). F) Based on the view from panel E, the THV depth was then measured as the distance from the native aortic annular plane to the inflow edge of the THV lying on top of the MS point of interest. The THV depth was measured using the CT scan, simulating a periprocedural angiographic projection that would result in measurement of the THV implantation depth exactly on top of the MS point of interest (THVRCC depth in this example). The process of C to E was repeated for all points of interest mentioned in panel A (THVCV depth was not measured). LBB: left bundle branch; LCC: left coronary cusp (red dot); MS: membranous septum; NCC: non-coronary cusp; RCC: right coronary cusp; THV: transcatheter heart valve
The MS was divided into several points of interest: MSNCC – posterior edge of the MS closest to the non-coronary cusp (NCC); MSRCC – anterior edge of the MS closest to the right coronary cusp (RCC); MS25, MS50 and MS75 - at 25%, 50% and 75% of the MS width from the MSNCC to the MSRCC, respectively; MSdeepest – at the deepest point of the MS; and MSCV - measurements in coronal view.
Based on the preprocedural and post-procedural CT analysis, the difference in THV depth and MS depth was calculated, e.g., at the anterior border of the MS closest to the RCC: ΔTHV-MSRCC = THVRCC depth – MSRCC depth. Calcifications of the native aortic leaflets and basal septum were assessed qualitatively and classified as either none, mild, moderate or severe.
Statistical analysis
Categorical variables are presented as count and percentage and compared using the chi-squared test. Continuous variables are expressed as mean±standard deviation and compared using the Student’s t-test, or median (interquartile range [IQR]) and compared using the Wilcoxon rank-sum test. The risk of new CA in subgroup analysis was calculated with exact binomial confidence limits.
Preprocedural and post-procedural ECG and CT characteristics were investigated as predictors for new CA after TAVI in simple logistic regression analysis. The MS depth was shortest and the THV implantation depth were greatest at the anterior edge of the MS, hence measurements at the MSRCC was chosen for further investigation. Odds ratio (OR) and area under the operating characteristic curve (AUC) from multiple logistic regression analysis were reported. For multiple logistic regression analysis, the set of predictor variables included for new CA was prosthesis type and MSRCC or ΔTHV-MSRCC. Interobserver variability was tested in 15 patients based on measurements of ΔTHV-MS along the entire width of the MS. The level of statistical significance was set at 5%. All statistical analyses were performed using SAS Enterprise Guide, version 7.15 (SAS Institute, Inc.).
Results
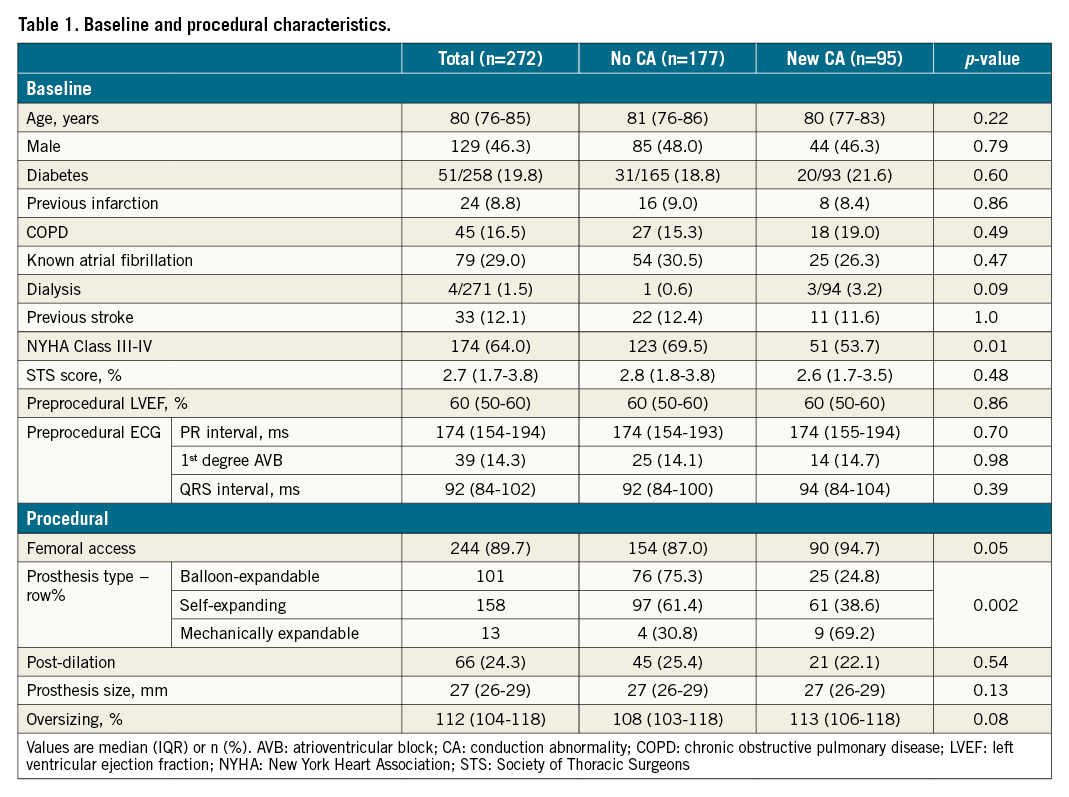
New CA developed in 95 of 272 patients (34.9%; 61 patients [22.4%] with new BBB and 34 patients [12.5%] with new HD-CA) (Figure 2). Baseline characteristics showed no differences between patients without and with new CA, except for the type of THV implanted and more patients developing CA being in NYHA Class III-IV (Table 1). Baseline characteristics of patients with new BBB compared to patients with new HD-CA are shown in Supplementary Table 1. The median time to PPM implantation in patients with new HD-CA was 7 days (IQR: 4-8 days). In 16 out of 29 patients who had a PPM implanted, a pacing percentage was available at a median of 167 days (IQR 42-305 days) after the TAVI procedure with a ventricular pacing percentage of 46.5% (IQR 1.8-91.5%). All had a back-up rate of 60 beats per minute. The median time from TAVI to the last available 12-lead ECG used for patient classification was 25 days (IQR: 3-33 days).
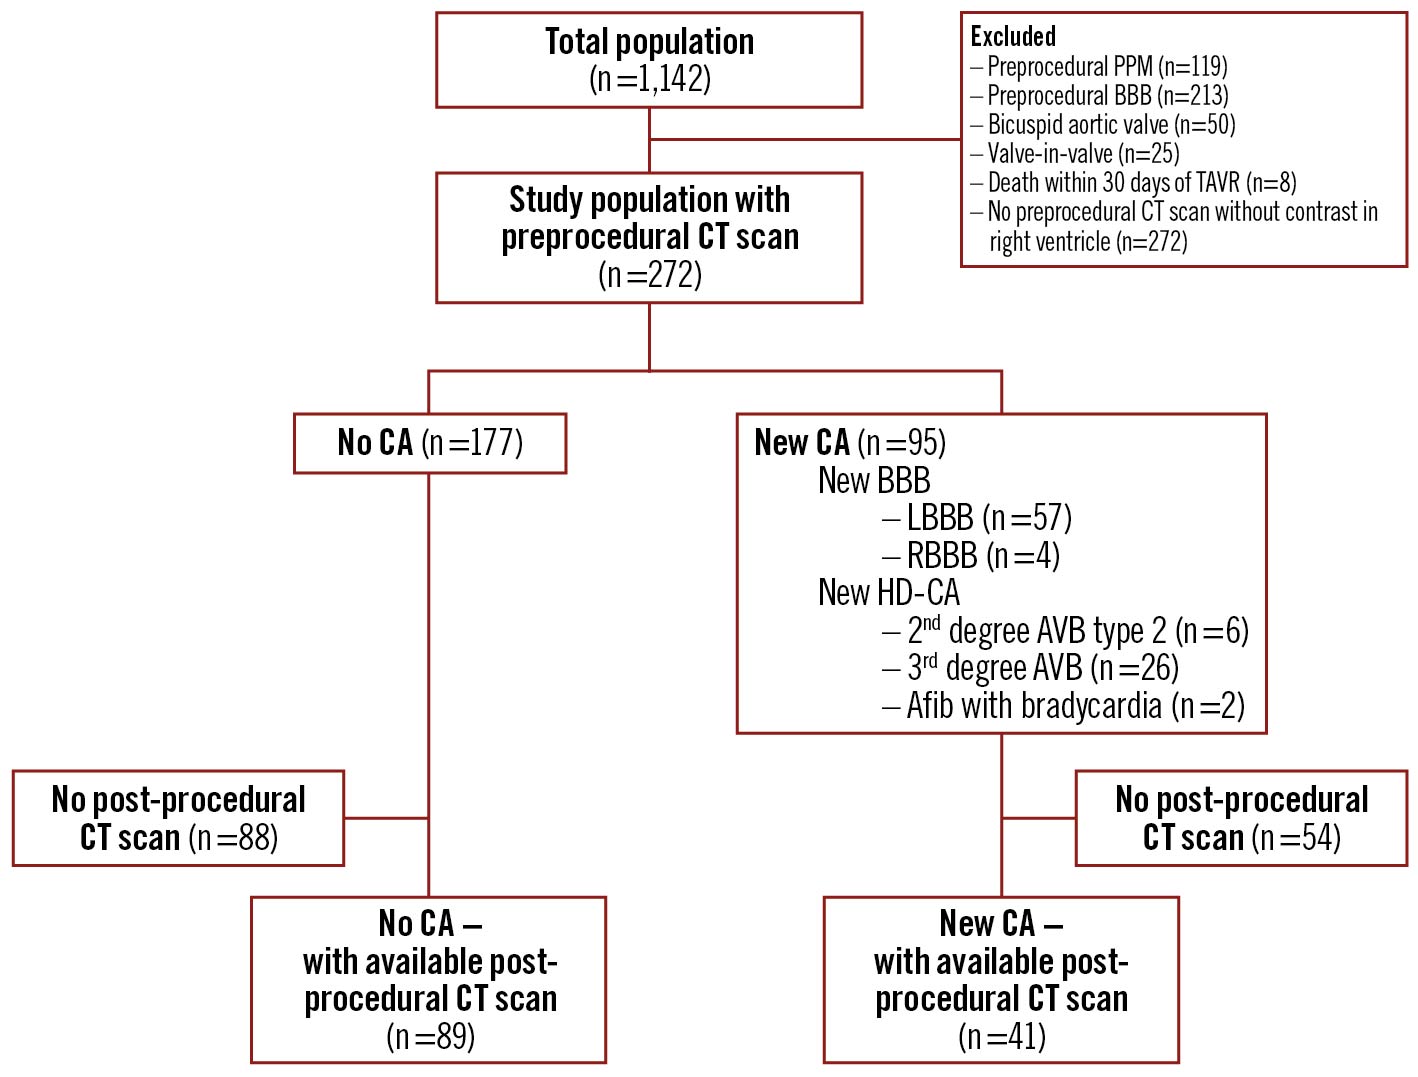
Figure 2. Study population. AVB: atrioventricular block; BBB: bundle branch block; CA: conduction abnormalities; CT: computed tomography; HD-CA: high-degree conduction abnormalities; PPM: permanent pacemaker; TAVI: transcatheter aortic valve implantation
Membranous septum morphology and THV implantation depth
The lower MS border was most frequently deepest at the posterior edge of the MS closest to the NCC (i.e., at the MSNCC) and was a median of 2.5 mm (IQR 1.4-3.8) deeper at the MSNCC when compared to the MSRCC (Figure 3A). On the other hand, the inflow portion of the THV was most frequently implanted deepest at the anterior edge of the MS closest to the RCC (i.e., at the MSRCC) and was a median of 0.5 mm (IQR 0.0-1.1) deeper at the MSRCC when compared to the MSNCC (Figure 3B). The overlap of the THV with the lower MS border was most frequently greatest at the anterior edge of the MS closest to the RCC (i.e., ΔTHV-MSRCC) and was a median of 3.2 mm (IQR 1.8–4.8) greater compared to the posterior edge of the MS closest to the NCC (i.e., ΔTHV-MSNCC) (Figure 3).
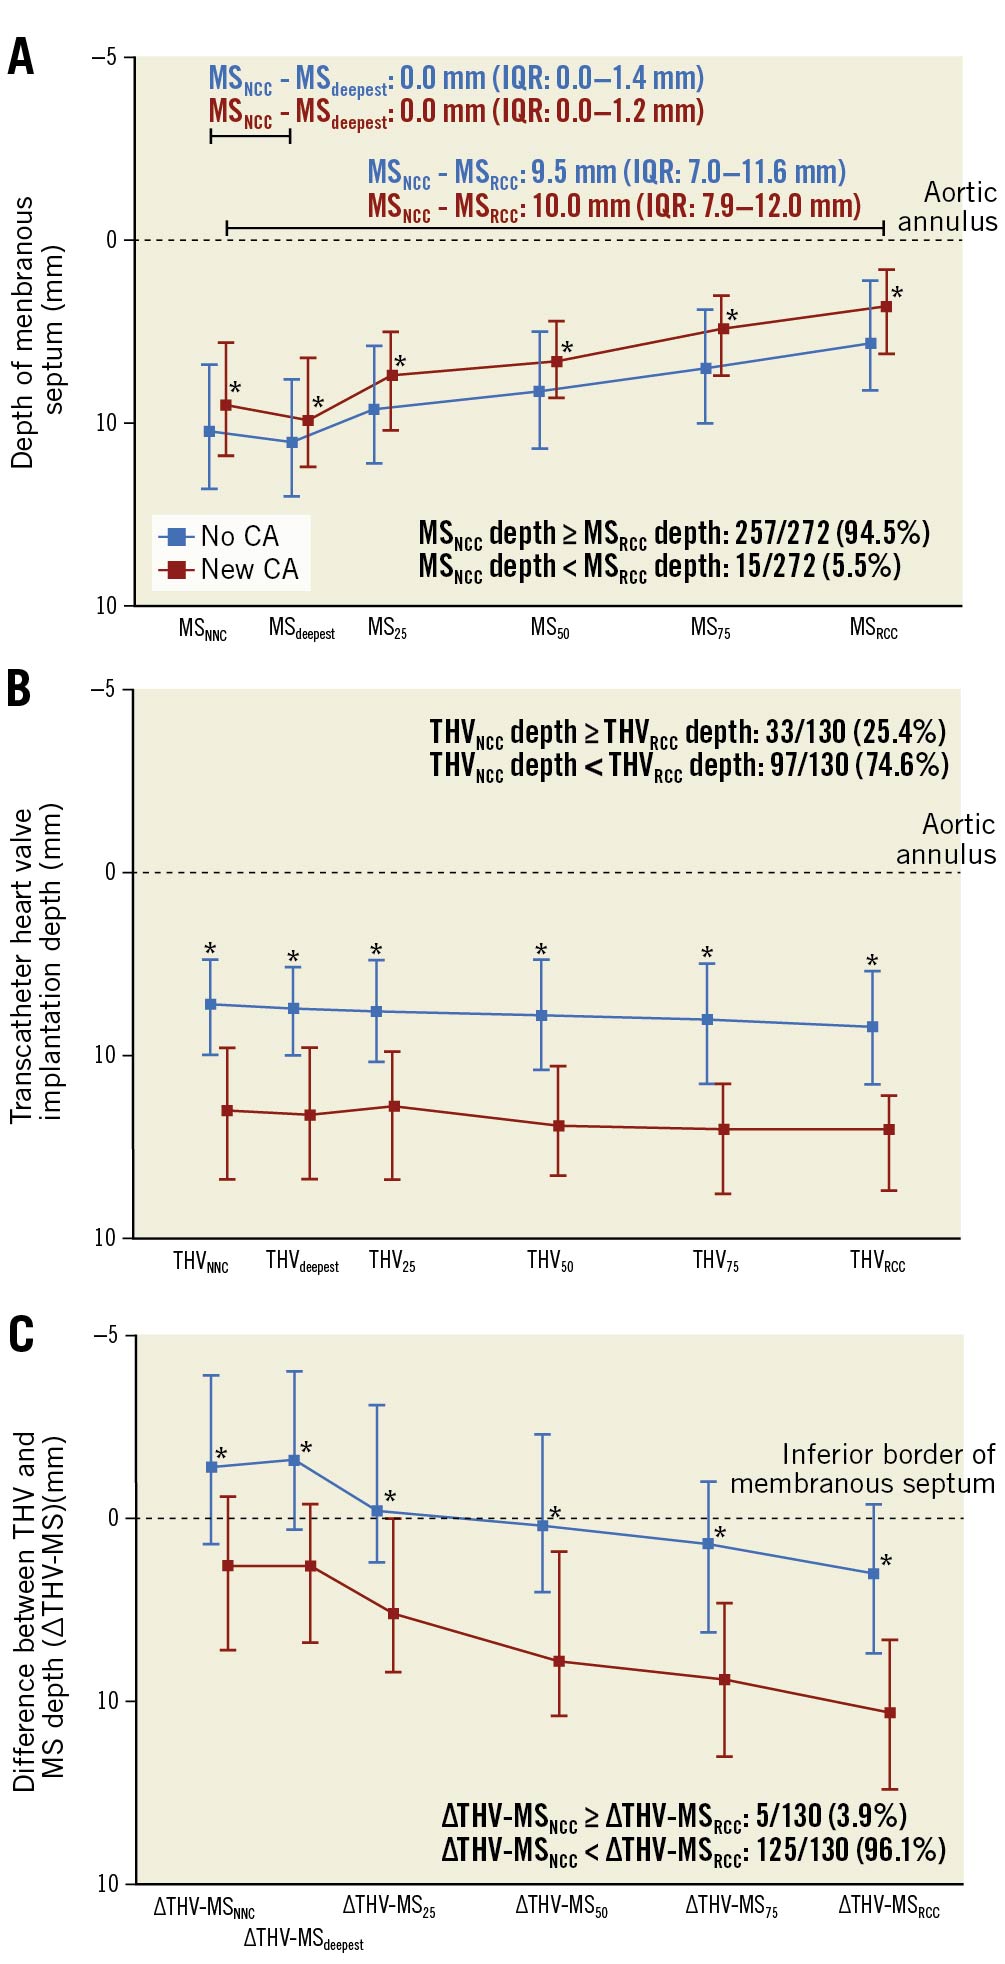
Figure 3. Dimensions of the membranous septum and transcatheter implantation depth for patients with or without conduction abnormality. Median and interquartile range shown. A) The MS depth measured at the posterior (MSNCC depth) and anterior (MSRCC depth) edges of the lower MS border, at 25% (MS25 depth), 50% (MS50 depth) and 75% (MS75 depth) of the MS width and at the deepest point (MSdeepest depth). B) THV depth measured at the same points of interest as in panel A. C) The difference in MS depth and THV depth (ΔTHV-MS=THV depth–MS depth) calculated for the same points of interest as in panel A. *p<0.05 for comparison between patients with and without new CA at each point of interest. CA: conduction abnormality; MS: membranous septum; NCC: non-coronary cusp; RCC: right coronary cusp; THV: transcatheter heart valve
The median MS width was similar between the two groups. Patients with new CA had a significantly shorter MS depth and greater THV implantation depth for all points of interest (i.e., MSNCC, MS25, MS50, MS75, MSRCC, MSdeepest, MSCV) when compared to patients without CA (Figure 3A, Figure 3B).
The median ΔTHV-MS was greater in patients with new CA at all points of interest when compared to patients without new CA (Figure 3C).
Logistic regression analysis of predictor for new-onset conduction abnormality
In simple logistic regression analysis, the odds for new CA increased significantly with shorter MS depth, greater THV implantation depth and greater ΔTHV-MS at all of points of interest except for MSCV depth (Supplementary Table 2).
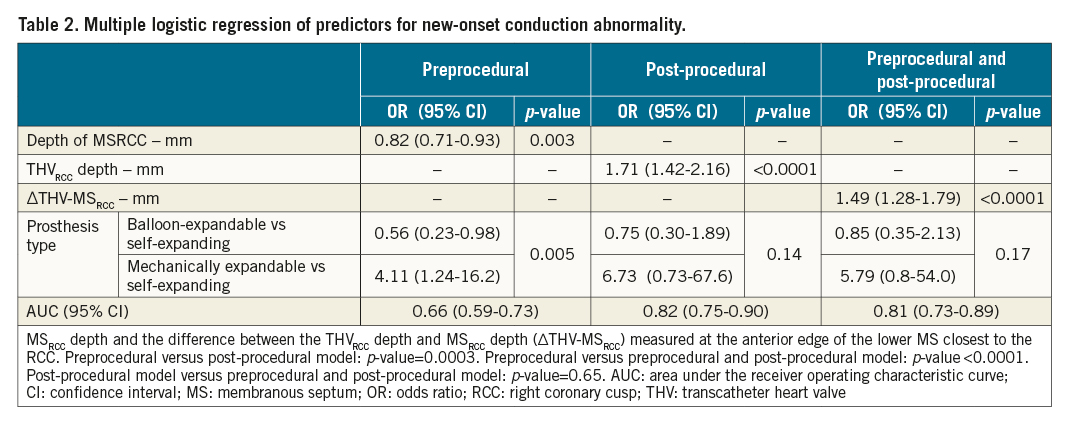
A multiple logistic regression model of preprocedural characteristics showed that the odds of new CA increased significantly with shorter MSRCC depth (OR 0.82, 95% CI: 0.71-0.93; p=0.003) with an AUC of 66% (95% CI: 59-73%); for post-procedural characteristics the odds increased with greater THVRCC implantation depth (OR 1.71, 95% CI: 1.42-2.16; p<0.0001; AUC 82%; 95% CI: 75-90%), and for preprocedural and post-procedural characteristics the odds for new CA increased with greater ΔTHV-MSRCC (OR 1.49, 95% CI: 1.28-1.79; p<0.0001; AUC of 81%; 95% CI: 73-89%) (Table 2).
Interobserver measurement had a paired difference for ΔTHV-MS of -0.7 mm (95% CI: -1.3 mm to -0.08 mm; p=0.03).
Risk of new-onset conduction abnormality
The risk of new CA was evaluated in intervals of 2.5 mm for ΔTHV-MSRCC. The risk of new CA increased with greater ΔTHV-MSRCC (p=0.0001) (Central illustration). In 28 of 130 patients (21.5%), the THV did not cross the lower MS border at the point of the MSRCC (i.e., ΔTHV-MSRCC <0 mm) and 2 of these developed new CA (7.1%, 95% CI: 0-16.7, 1 with new BBB and 1 with new HD-CA [3.6%, 95% CI: 0-10.5]). New CA developed in 6 of 32 patients (18.8%, 95% CI: 5.2–32.3; new BBB in 5 patients [15.6%, 95% CI: 3.0-28.2] and new HD-CA in 1 patient [3.1%, 95% CI: 0-9.2]) with ΔTHV-MSRCC (≥ 0.0 mm; <2.5 mm), and in 33 of 70 patients (47.1%, 95% CI: 35.5-58.8%) with ΔTHV-MSRCC ≥2.5 mm (new BBB in 17 patients [24.3%, 95% CI: 14.2-34.3%] and new HD-CA in 16 patients [22.9%, 95% CI: 13.0-32.7%]).
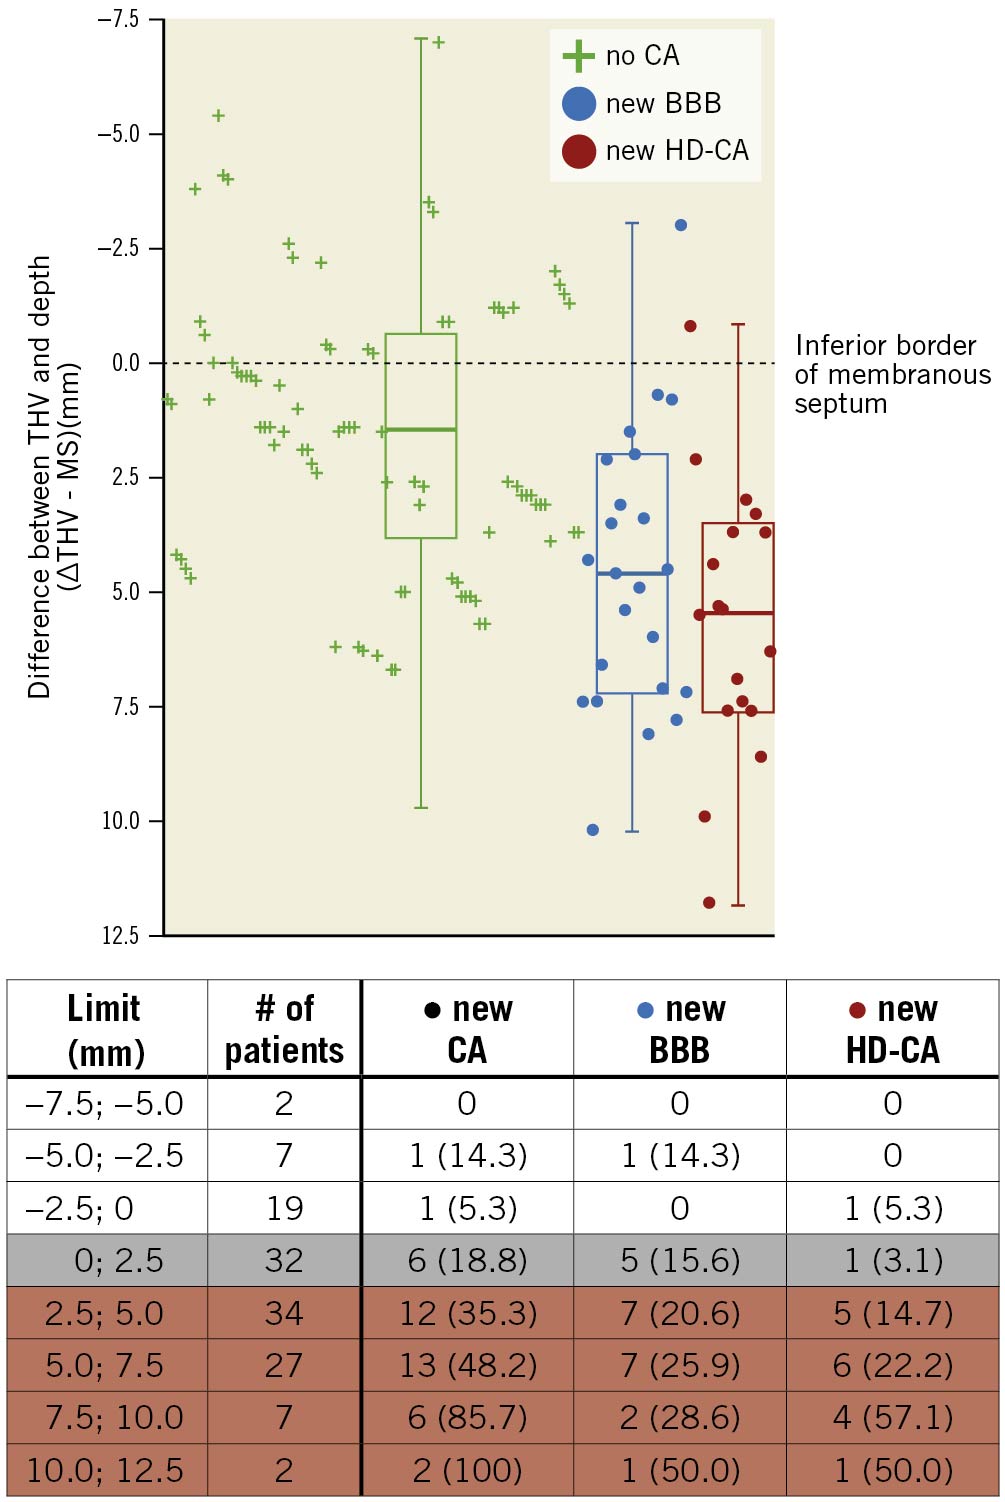
Central illustration. Risk of conduction abnormality based on difference in membranous septum depth and transcatheter heart valve implantation depth. The risk of new CA based on the difference between the THV implantation depth and MS depth at the anterior edge of the MS closest to the RCC (ΔTHV-MSRCC). The risk was evaluated in intervals of 2.5 mm with the membranous septum as the reference. BBB: bundle branch block; CA: conduction abnormality; HD-CA: high-degree conduction abnormality; MS: membranous septum; RCC: right coronary cusp; THV: transcatheter heart valve
Transcatheter heart valve intersection with the membranous septum
The location where the THV first intersected the lower border of the MS along its width in the posterior-anterior direction (i.e., from the MSNCC to the MSRCC) is shown in Supplementary Figure 1. New CA developed in 34 of 85 patients (40.0%) where the THV first intersected the lower MS border within the first 50% of the MS width from the NCC. In 45 patients, the THV first intersected with the lower MS border after more than 50% of the MS width from the NCC or the THV had no contact with the lower MS border. New CA developed in 7 of these patients (15.6%); the THV intersected the lower MS border before the MSRCC in all these events except in one patient who developed new BBB.
Discussion
The depth of the MS varied depending on the site of measuring along the width of the MS and was a median of 2.5 mm shorter at the edge of the MS closest to the RCC when compared to the edge closest to the NCC. MS depth was shorter and the THV implantation depth and ΔTHV-MS were greater along the entire width of the MS for patients with new CA as compared to patients who did not develop CA. With greater overlap of the THVRCC and the lower border of the MSRCC the risk of new BBB and successively new HD-CA increased progressively.
Variations of the membranous septum
In accordance with previous studies, the depth of the lower MS border had a large variation between patients35, but was also found to vary along the MS width within the same patient. This should be considered, as the AV conduction system has been described as being located at the lower border of the MS along its entire width6789. The penetrating part of the bundle of His emerges at the posterior edge of the lower border of the MS closest to the NCC (median MSNCC depth=4.8 mm in the current study) and continues as the branching part of the bundle of His after one half of the lower MS border (median MS50 depth=3.7 mm in the current study). The branching portion of the bundle of His gives off the fanned out strands of the left bundle branch as it continues towards the anterior edge of the lower MS border closest to the RCC (median MSRCC depth=2.0 mm in the current study) (Figure 1B) 6789.
The aim should be to avoid the need for PPM implantation and it is equally important to avoid the development of new-onset BBB (often LBBB and rarely RBBB) after TAVI, considering the increased risk of all-cause mortality and risk of heart failure hospitalisations associated with the development of LBBB or the need for PPM after TAVI14. Using the MS as a surrogate for the distance of the target THV implantation zone and to the AV conduction system, the most conservative depth to measure was at the lower MS border at the anterior edge closest to the RCC (i.e., the MSRCC), which in the current study was a median of 2.5 mm shorter than the depth measured at the posterior edge of the MS closest to the NCC (i.e., MSNCC).
The MS depth measured in coronal view has previously been reported to predict the development of new AV block4. However, this methodology implies some uncertainty. As the nadirs of the aortic leaflets are not definable in this unformatted plane, there is a risk of including a variable section of the interleaflet triangle above the aortic annulus, which may result in overestimation of the MS depth. Moreover, depending on the aortic root angulation, the MS depth could be measured in an oblique direction not perpendicular to the aortic annulus25 (Supplementary Figure 2).
Depth of aortic transcatheter heart valve implantation
The increasing risk of new HD-CA mediated by greater ΔTHV-MSRCC might be due to the THV interacting with more proximal parts of the AV conduction system. Further, it has been reported that greater ΔTHV-MS was correlated to a greater contact pressure over the lower MS border, which was associated with the development of new CA after TAVI5. The AV conduction system is often only covered by a thin layer of endocardium at the lower MS border, but is also found to run several millimetres within the muscular septum in 12.5-32.4% of patients79. The padding of muscular septum might explain why some patients with a ΔTHV-MSRCC ≥0.0 mm do not develop CA after TAVI. Conversely, in some cases the bundle of His has been found to be contained totally within the inferior border of the MS, locating the origin of the LBB more anteriorly than usual89, potentially causing some patients to be at risk of new HD-CA even though ΔTHV-MSRCC is <0 mm.
The small extent of the MSRCC depth might limit the usage of measuring the MS depth in a clinical setting, as the THV implantation depth can be difficult to control within a few millimetres. Likewise, the abovementioned factors might result in too great complexity for the MS depth to be used reliably and which is the reason why we found the THV implantation depth to be an equal predictor for the development of CA after TAVI. However, in the MIDAS study the THV implantation depth was reduced from a mean of 3.3 mm in the retrospective group compared to a mean depth of 2.3 mm in the patient population where THV implantation depth was guided by the MS depth and the risk of new CA statistically significantly reduced (9.7% compared with 3.0%)10.
Clinical impact
In the current study, the THV implantation depth measured at the edge of the MS closest to the RCC in general gave the most conservative distance between the inflow portion of the THV and the lower border of the MS. However, isolating this part of the MS tends to lead to C-arm angulations and greater tissue thickness, suboptimal for the THV implantation view. Alternatively, bringing the planes of the THV inflow portion and the native aortic annulus parallel would result in the THV implantation depth measured at a single location being equal to all measurements of THV implantation depth along the circumference of the aortic annulus. Using the double S-curve approach for implantation gives the C-arm angulation point where the delivery catheter and the aortic annulus appear perpendicular, but the method is cumbersome without the right software. However, the implantation view obtained with the double S-curve approach has recently been reported to be very similar to the implantation view obtained with the cusp-overlap method where the LCC and RCC are overlapping and the NCC is isolated inferiorly15.
Transient new CA after TAVI is common and thought to be due to inflammation and oedema in the tissue of the AV conduction system and often resolves within 30 days. In a recent study, multiple regression analysis including preprocedural and post-procedural characteristics showed that ΔTHV-MS ≥3 mm and LCC calcification predicted the development of persistent pacing dependency 30 days after TAVI in patients with PPM implantation after TAVI11. The increased risk of persistent CA in some patients after TAVI with greater overlap of the MS and lower inflow part of the THV is probably due to the struts of the THV crushing and causing permanent damage to the AV conduction system.
With an increased risk of heart failure and death in patients with BBB or the need for right ventricular pacing14, the development of new CA after TAVI is particularly problematic as the indication for TAVI moves to patients with longer life expectancy16. Perhaps patients with a high risk of persistent pacing dependency and long life expectancy might benefit from cardiac resynchronisation therapy or bundle of His pacing, while patients with a transient need for a PPM could benefit from a lowered back-up rate so as to promote intrinsic conduction. However, the optimal follow-up therapy for patients with new CA after TAVI is still unknown. Whether measuring the THV implantation depth based on the cusp-overlap method, with or without the MSRCC depth as a guide, would result in a higher rate of THV repositioning and lower rate of new CA needs to be confirmed in future studies.
Limitations
Multiple types of THV were included in the study. The various THVs might exert different radial force at their ventricular part, which is known to be associated with the development of new CA5. There is a possibility that the preprocedural and post-procedural CT scans were not perfectly lined up, as alignment was dependent on several measurements. Further, the high exclusion rate and the retrospective nature of the study may have led to bias.
Conclusion
The MS is a small and irregular structure. The depth of the MS varied between patients and also within the same patient depending on the site of measuring along the width of the MS and was shortest at the edge of the MS closest to the RCC. The difference between THVRCC depth and MSRCC depth at the edge of the MS closest to the RCC (ΔTHV-MSRCC) predicted the development of new BBB and successively new HD-CA after TAVI. Future studies should investigate the clinical impact of using the MSRCC depth as a patient-specific lower limit for THV implantation depth.
Impact on daily practice
The depth of the MS varies significantly within the same patient depending on the site of measurement along the width of the MS. This should be taken into consideration both in a scientific and in a clinical setting when using MS depth as a predictor for the development of new BBB or HD-CA after TAVI. Further, with greater overlap of the THV and the lower border of the MS, the risk of new BBB and new HD-CA increased progressively.
Guest Editor
This paper was guest edited by Franz-Josef Neumann, MD; Department of Cardiology and Angiology II, University Heart Center Freiburg - Bad Krozingen, Bad Krozingen, Germany.
Conflict of interest statement
T. H. Jørgensen has received a research grant from Edwards Lifesciences. L. Søndergaard has received consultant fees and institutional research grants from Abbott, Boston Scientific, Edwards Lifesciences, Medtronic and Symetis. J.H. Svendsen is on the advisory board of Medtronic, has received speaker fees from Medtronic and Biotronik, and has received institutional research grants from Medtronic, Biotronik and Gilead. N. Piazza is a consultant to Medtronic, Peijia and MicroPort. O. De Backer has received institutional research grants and consulting fees from Abbott and Boston Scientific. The Guest Editor reports lecture fees paid to his institution from Amgen, Bayer Healthcare, Biotronik, Boehringer Ingelheim, Boston Scientific, Daiichi Sankyo, Edwards Lifesciences, Ferrer, Pfizer and Novartis, consultancy fees paid to his institution from Boehringer Ingelheim, and grant support from Bayer Healthcare, Boston Scientific, Biotronik, Edwards Lifesciences, GlaxoSmithKline, Medtronic and Pfizer. The other authors have no conflicts of interest to declare.
Supplementary data
To read the full content of this article, please download the PDF.