Abstract
Background: Optical flow ratio (OFR) is a novel method for fast computation of fractional flow reserve (FFR) from optical coherence tomography (OCT) images.
Aims: We aimed to evaluate the accuracy of OFR in predicting post-percutaneous coronary intervention (PCI) FFR and the impact of stent expansion on within-stent OFR pressure drop (in-stent OFR).
Methods: Post-PCI OFR was computed in patients with both OCT and FFR interrogation immediately after PCI. Calculation of post-PCI OFR (called simulated residual OFR) from pre-PCI OCT pullbacks after elimination of the stenotic segment by virtual stenting was performed in a subgroup of patients who had pre-PCI OCT images. Stent underexpansion was quantified by the minimum expansion index (MEI) of the stented segment.
Results: A total of 125 paired comparisons between post-PCI OFR and FFR were obtained in 119 patients, among which simulated residual OFR was obtained in 64 vessels. Mean post-PCI FFR was 0.92±0.05. Post-PCI OFR showed good correlation (r=0.74, p<0.001) and agreement (mean difference=–0.01±0.03, p=0.051) with FFR. The accuracy in predicting post-PCI FFR ≤0.90 was 84% for post-PCI OFR. Simulated residual OFR significantly correlated with post-PCI FFR (r=0.42, p<0.001). MEI showed a moderate correlation (r=–0.49, p<0.001) with in-stent OFR.
Conclusions: Post-PCI OFR showed good diagnostic concordance with post-PCI FFR. Simulated residual OFR significantly correlated with post-PCI FFR. Stent underexpansion significantly correlated with in-stent pressure drop.
Introduction
Intracoronary optical coherence tomography (OCT) imaging allows a detailed assessment of coronary lumen, plaque morphology, stent apposition and expansion during percutaneous coronary intervention (PCI)1. Fractional flow reserve (FFR) can be used to assess the functional result immediately after PCI2, with reported implications in terms of long-term outcomes3. Studies have advocated the use of both FFR and OCT to optimise coronary interventions and to validate the final interventional result4. However, this approach requires two disposables and separate invasive diagnostic tests (namely OCT and FFR), with increased procedural complexity, time and cost. For this reason, it is not a viable option for most healthcare systems.
Recently, optical flow ratio (OFR), an OCT-based method for fast computation of FFR, which does not require induced hyperaemia or the use of a pressure wire, has been validated in de novo lesions or in-stent restenosis with high diagnostic concordance with FFR5,6,7. However, the role of post-PCI OFR in evaluating coronary physiology immediately after PCI has not been fully investigated. We have developed a method of calculation of post-PCI OFR (called simulated residual OFR) from the pre-PCI OCT run after elimination of the stenotic segment by virtual stenting. Whether simulated residual OFR can be used to predict what will be the physiological result after treating the target lesion also needs to be established.
The aims of the present study were to validate: 1) the accuracy of post-PCI OFR computation compared to wire-based post-PCI FFR measurement; 2) the relationship between simulated residual OFR and post-PCI FFR; and 3) the impact of stent expansion and apposition on in-stent pressure drop derived from OFR pullback.
Methods
STUDY DESIGN AND PATIENT POPULATION
The present study is a post hoc analysis of combined data sets from the DOCTORS (Does Optical Coherence Tomography Optimize Results of Stenting, NCT01743274) study and the OxOPT-PCI (The Oxford Optimisation of PCI Study, NCT03111940) study. The multicentre DOCTORS study was a prospective clinical trial randomising patients with non-ST-segment elevation acute coronary syndromes (NSTE-ACS) to either OCT-guided or angiography-guided PCI, with final post-PCI FFR as the primary endpoint8. The OxOPT-PCI study was a prospective, single-centre, observational trial aimed at investigating the impact of a combined FFR and OCT measurement strategy on PCI optimisation for patients undergoing complex PCI9. Detailed study design, endpoints and inclusion and exclusion criteria have been published elsewhere8,9.
All imaging data including coronary angiography and OCT images were sent to an independent academic core laboratory (CardHemo; Med-X Research Institute, Shanghai Jiao Tong University, China) for analysis. Post-PCI OFR analyses were performed in all selected post-PCI OCT images, except when severe artefacts or poor image quality precluded clear visualisation of the coronary lumen. However, post-PCI OFR analyses were excluded from comparison with post-PCI FFR if any of the following was present: 1) vessel spasm or injury during post-PCI OCT imaging or FFR measurement; 2) myocardial bridge in the interrogated vessel or substantial thrombosis identified by post-PCI OCT; 3) post-PCI OCT pullback not covering the entire stented segment or any residual lesion(s) outside the stented segment. Specifically, if there was residual stenosis between the optical sensor and the pressure sensor, post-PCI OFR of the interrogated vessel had to be excluded from comparison with post-PCI FFR. For vessels with suboptimal post-PCI FFR (≤0.90) and/or OCT results that underwent further PCI optimisation in the OxOPT-PCI study9, paired post-PCI FFR and OFR comparisons were performed both before and after PCI optimisation. For vessels without further optimisation, the OCT pullback image acquired at completion of the procedure, when no further additional interventions were performed, was used for post-PCI OFR computation to be compared with the final FFR value. For each interrogated vessel, simulated residual OFR was assessed using pre-PCI OCT image pullbacks, when available.
The study complied with the Declaration of Helsinki for investigation in human beings and the study protocol was approved by the institutional review board. All patients provided informed consent for enrolment in the institutional database for potential future analyses.
OCT ACQUISITION
Details of OCT image acquisition and analysis8,9,10,11,12 are described in Supplementary Appendix 1.
COMPUTATION OF POST-PCI OFR
OFR analyses were performed using the OctPlus software, version 2.0 (Pulse Medical Imaging Technology, Shanghai, China) by two experienced analysts who were blinded to FFR and clinical data. Previous studies have reported low intra- and inter-observer variability in OFR analysis7. Detailed methodologies for OFR computation have been published elsewhere5. In summary, lumen contours were delineated and reconstructed in 3D. The side branch ostia were reconstructed and the reference lumen size incorporating the step-down phenomenon across bifurcations was quantified5. Stent struts were automatically detected using a deep learning-based algorithm13 and combined with the lumen geometry to compute OFR pullback along the interrogated vessel. The OFR value at the distal location of the interrogated vessel was used for comparison with FFR. The pressure drop along the stented segments (denoted as in-stent OFR) was calculated as drop of OFR value within the stent (Central illustration). For sequential stenoses requiring two OCT pullbacks, both were combined for OFR computation using the previously described methodology7.
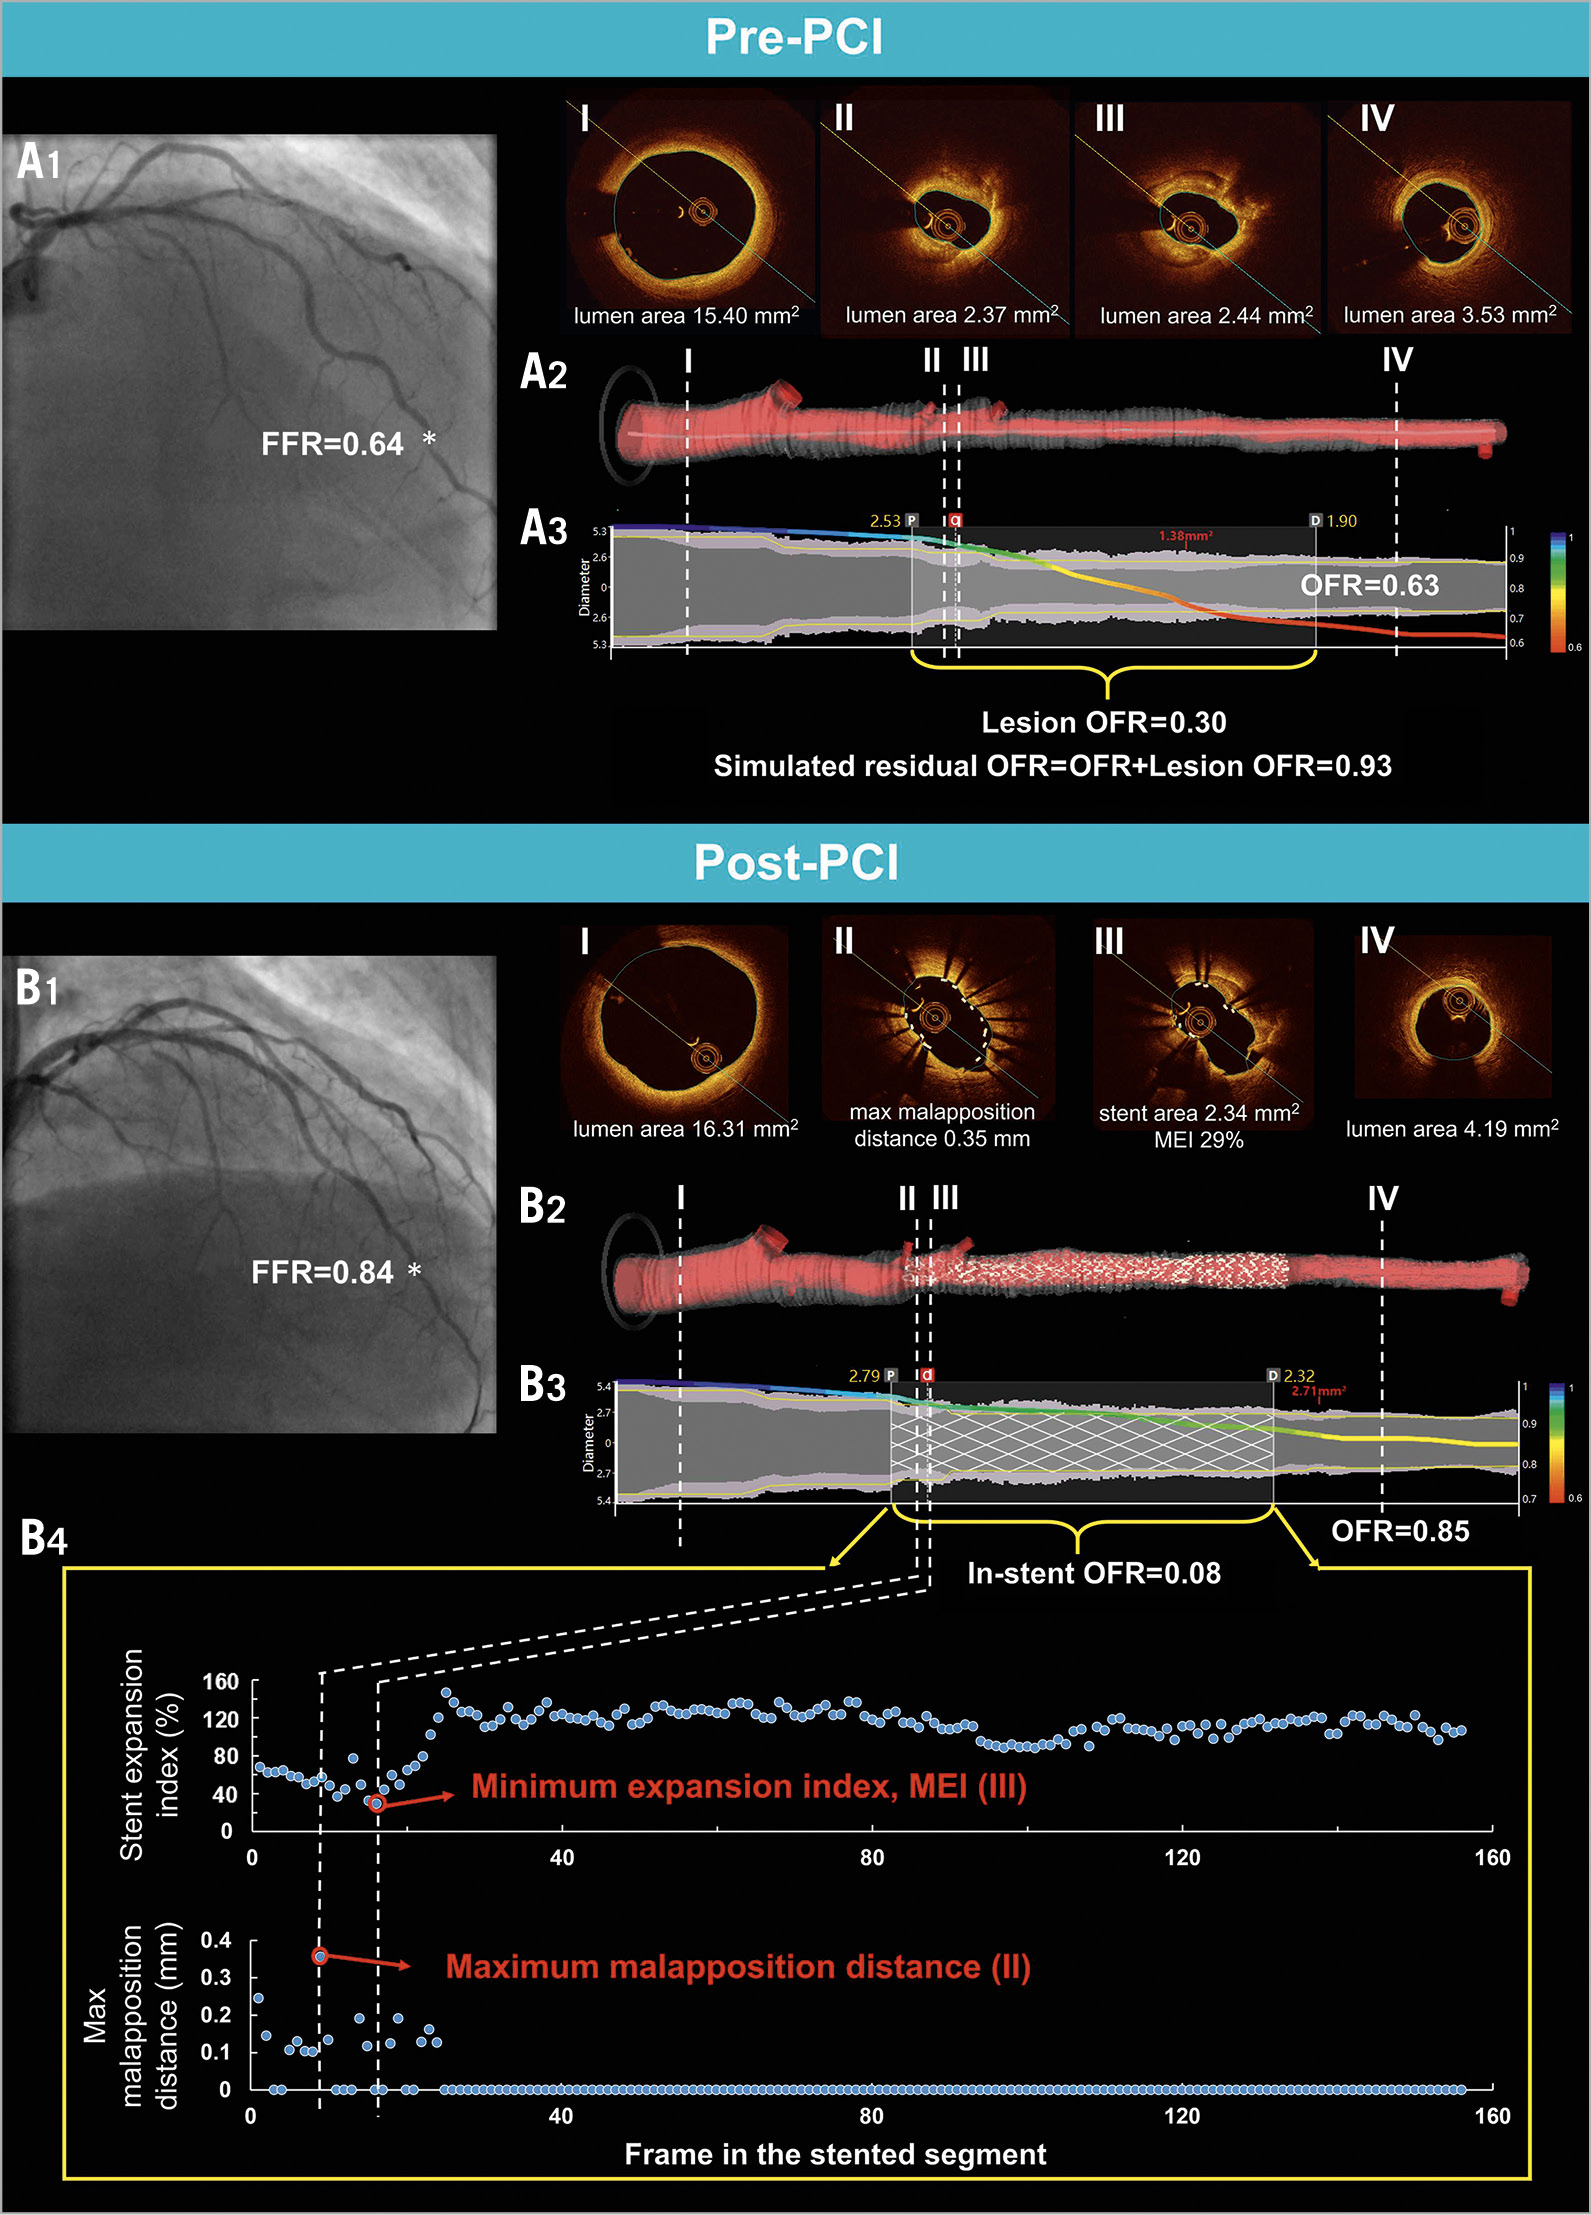
Central illustration. Computation of simulated residual OFR, post-PCI OFR, and quantification of stent expansion and apposition. Top: computation of simulated residual OFR using pre-PCI OFR pullback. A1) Coronary angiography of LAD before PCI. FFR measured at asterisk was 0.64. A2) 3D reconstructed artery. The OCT images at the proximal reference lumen, stenotic lesion(s), and distal reference lumen were shown in I, II, III, and IV, respectively. A3) The computed OFR along the vessel is presented by a virtual pressure pullback for co-registration between pressure drop and anatomy. OFR of the interrogated vessel was 0.63, with drop of OFR in the selected lesion (lesion OFR) of 0.30. Simulated residual OFR was calculated as 0.93. Middle and bottom: computation of post-PCI OFR and quantification of stent expansion and apposition. B1) Coronary angiography of LAD after PCI. FFR measured at asterisk was 0.84. B2) 3D reconstructed artery and the implanted stent. B3) Computed OFR pullback co-registered with anatomy. Vessel OFR was 0.85, with drop of OFR inside the stent (in-stent OFR) of 0.08. B4) Distribution of stent expansion index and maximum malapposition distance of each frame along the stented segment. In the post-PCI panel, the frame shown in III had MEI, while the frame shown in II had maximum strut-lumen distance. FFR: fractional flow reserve; LAD: left anterior descending artery; MEI: minimum expansion index; OCT: optical coherence tomography; OFR: optical flow ratio; PCI: percutaneous coronary intervention
COMPUTATION OF SIMULATED RESIDUAL OFR BY VIRTUAL STENTING
The Central illustration shows the computation of simulated residual OFR from pre-PCI OCT images by virtual stenting. Firstly, the pre-PCI OFR value of the interrogated vessel was calculated. Subsequently, the proximal and distal landmarks of the intention-to-treat lesion were selected according to the proximal and distal edges of the implanted stent(s) from the post-PCI OCT pullback image. Assuming that the identified lesion was completely resolved by virtual stenting and no residual pressure drop was left behind, an OFR value without the impact of the virtually treated lesion, namely simulated residual OFR, was reported by the software. The simulated residual OFR, obtainable prior to PCI, was developed to provide an estimate of the maximally achievable post-PCI FFR.
QUANTIFICATION OF STENT APPOSITION AND EXPANSION
Stent apposition and expansion were quantified based on 3D reconstruction of the stent struts13 and lumen geometry (Central illustration). Significant stent malapposition was quantified as the total number of struts with a strut-to-lumen distance above 200 μm14. Stent expansion index was calculated in each cross-section along the stented segment as: (stent area/reference lumen area) × 100% (Central illustration). The method for deriving the reference lumen was detailed by Yu et al5. Briefly, the cut-plane perpendicular to the side branch centreline was reconstructed, and the area of the side branch ostium was computed. Bifurcation fractal laws were then applied to calculate the reference vessel size with the step-down phenomenon when crossing bifurcations. The minimum expansion index (MEI) along the entire stented segment was used to quantify stent underexpansion. The differences in quantifying stent expansion between our method and a previous method15 are shown in Supplementary Figure 1.
FFR MEASUREMENT AND ANALYSIS
Details for FFR measurement have been reported in the main studies8,9,16. Fractional flow reserve was measured using a coronary pressure guidewire (PressureWire™; St. Jude Medical, St. Paul, MN, USA). Pressure equalisation was performed at the guiding catheter tip before advancing the pressure wire beyond the stenosis. After administration of intracoronary nitrates, maximal hyperaemia for FFR measurement was induced using intravenous adenosine at 140 mg kg–1 min–1, or intracoronary bolus of adenosine of 150 μg, followed by a flush of 10 ml of isotonic saline. The ratio between distal coronary pressure (Pd) and aortic pressure (Pa) during maximal hyperaemia was calculated as the FFR value. The pressure sensor was pulled back at the tip of the guiding catheter to exclude pressure drift.
FFR tracings were analysed at the participating centres in the DOCTORS and OxOPT-PCI studies8,9. After blinded completion of all OFR analyses and subsequent screening for comparison with post-PCI FFR, FFR values were disclosed to the core laboratory.
QUANTITATIVE CORONARY ANGIOGRAPHY
All angiograms were analysed using AngioPlus Core (Pulse Medical Imaging Technology, Shanghai, China) in the core laboratory. For each interrogated vessel, the post-PCI angiographic view with minimal vessel overlap at the interrogated segment and its side branches was selected for analysis.
STATISTICAL ANALYSIS
Continuous variables were tested for normal distribution by the Kolmogorov-Smirnov test and are reported as mean±standard deviation if normally distributed or as median (quartiles) if non-normally distributed. Categorical variables are reported as counts (percentage). Spearman’s correlation coefficient was used for correlation analysis. Linear regression analysis was used to determine the proportional bias and constant bias between paired variables. Bland-Altman analysis was used to test the agreement between different continuous variables. Comparison of the limit of agreement between vessels with intravenous or intracoronary adenosine infusion was performed by the F-test. The between-centre heterogeneity for assessment of the mean agreement between post-PCI OFR and FFR was tested by the I2 statistics.
The area under the curve (AUC) by receiver operating characteristic (ROC) curve analysis by the DeLong method was used to compare the accuracy of post-PCI OFR and minimal lumen area (MLA) in predicting post-PCI FFR ≤0.903. The Youden index was used as the criterion to determine the best cut-off value for MLA in predicting post-PCI FFR ≤0.90. All statistical analyses were performed with MedCalc, version 14.12 (MedCalc Software, Ostend, Belgium). A two-sided value of p<0.05 was considered statistically significant.
Results
BASELINE CLINICAL AND LESION CHARACTERISTICS
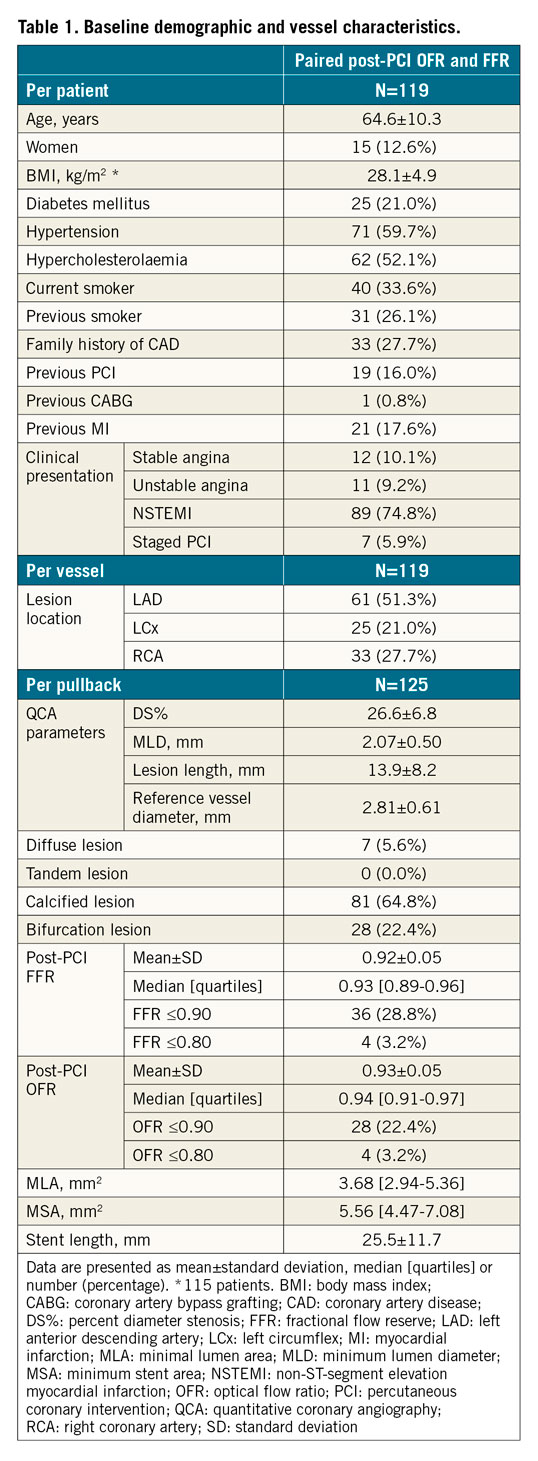
A total of 120 patients from the OCT-guided PCI group within the DOCTORS study and 35 patients in the OxOPT-PCI study were screened. In the core laboratory, 12 OCT pullbacks were excluded due to imaging artefacts (n=11) or suboptimal OCT blood clearance (n=1). Thirty pullbacks were excluded from comparison with FFR according to the exclusion criteria, resulting in 119 vessels from 119 patients with 125 pullbacks for paired comparison of post-PCI OFR and FFR. Among 93 patients who also had pre-PCI OCT images, 29 pullbacks were excluded from simulated residual OFR analysis, resulting in 64 vessels with paired simulated residual OFR, post-PCI OFR and FFR comparison (Figure 1). Baseline demographic and vessel characteristics are demonstrated in Table 1 and Supplementary Table 1. OCT-detected qualitative and quantitative features are shown in Supplementary Table 2.
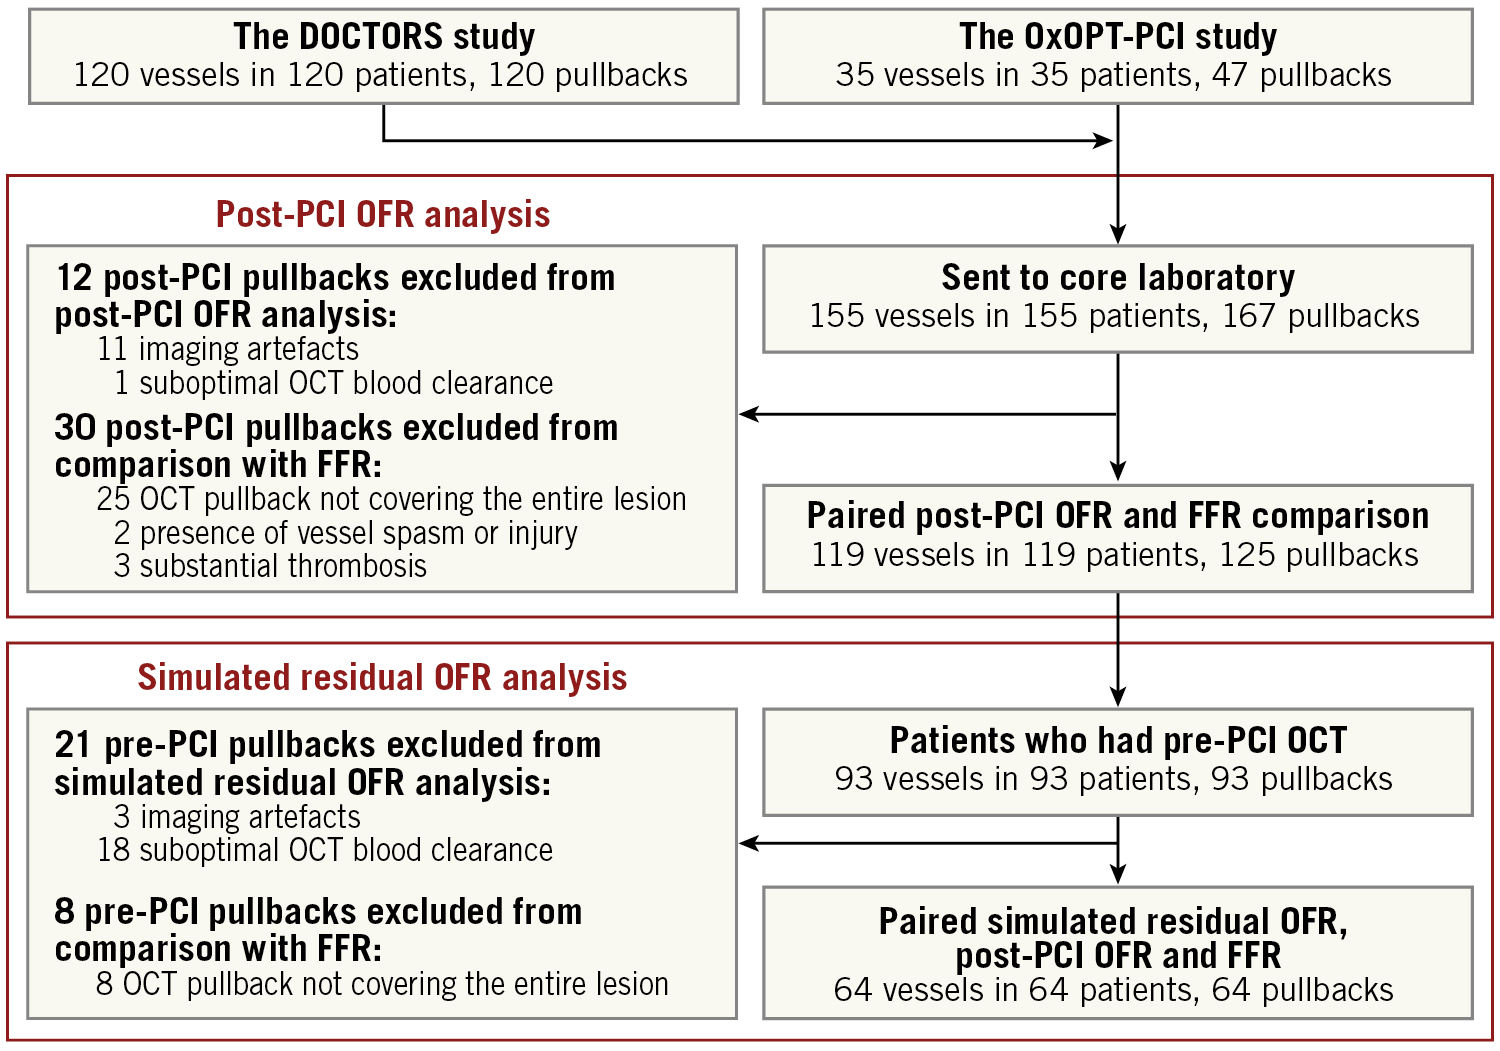
Figure 1. Study flow chart. FFR: fractional flow reserve; OCT: optical coherence tomography; OFR: optical flow ratio; PCI: percutaneous coronary intervention
ACCURACY OF POST-PCI OFR IN PREDICTING POST-PCI FFR
FFR had a mean of 0.92±0.05, and OFR had a mean of 0.93±0.05. FFR ≤0.90 and OFR ≤0.90 were identified in 36 (28.8%) and 28 (22.4%) pullbacks, respectively. Supplementary Figure 2 shows the cumulative frequency of post-PCI OFR and FFR.
Post-PCI OFR showed good correlation (r=0.74, p<0.001) and excellent agreement (mean difference=–0.01±0.03, p=0.051, range from –0.10 to 0.10) with FFR (Figure 2). The agreement between post-PCI OFR and FFR was similar in vessels with intravenous or intracoronary adenosine infusion (standard deviation of the difference=0.03 versus 0.04, p=0.132). The I2 statistic for assessment of the mean agreement between post-PCI OFR and FFR was 0.00 (p=0.765), indicating that the between-centre variance component was small enough to be ignored.
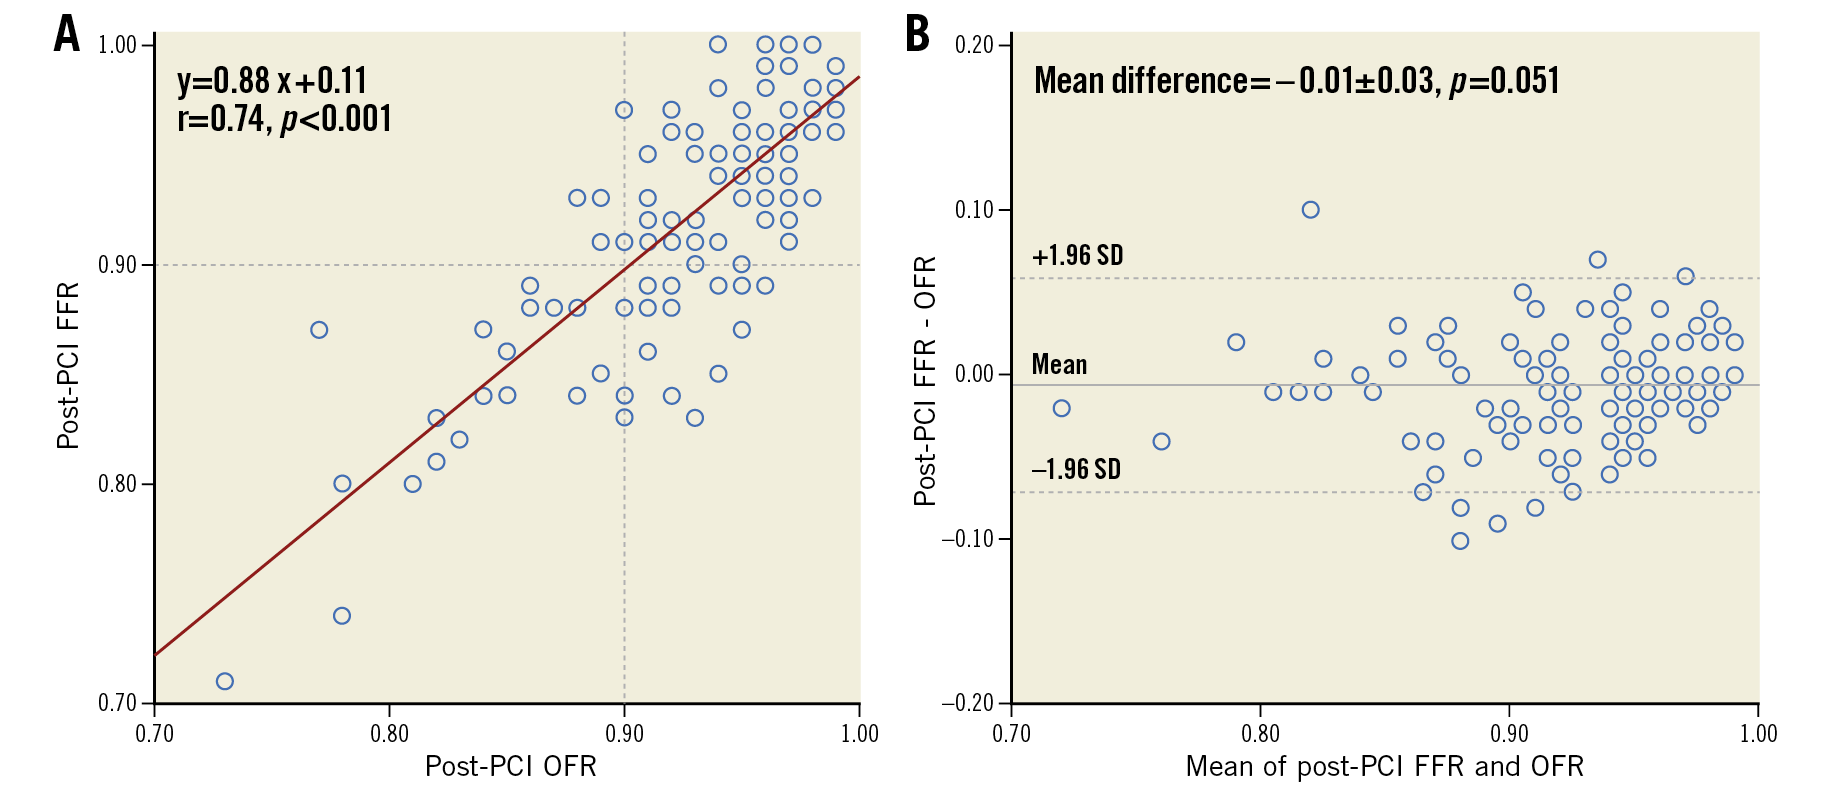
Figure 2. Correlation and agreement between post-PCI OFR and FFR. FFR: fractional flow reserve; OFR: optical flow ratio; PCI: percutaneous coronary intervention
Using a cut-off value of ≤0.903 for identifying suboptimal stenting result by physiological standard, the accuracy of post-PCI OFR in predicting post-PCI FFR was 84% (95% CI: 77-91%), with 22 true positives, 83 true negatives, 6 false positives, and 14 false negatives. The sensitivity, specificity, positive predictive value, negative predictive value, positive likelihood ratio, and negative likelihood ratio for post-PCI OFR ≤0.90 to identify post-PCI FFR ≤0.90 was 61%, 93%, 79%, 86%, 9.1, and 0.42, respectively (Table 2). The diagnostic accuracy and numerical agreement of post-PCI OFR ≤0.90 in predicting post-PCI FFR ≤0.90 was independent of the presence of OCT-detected stent malapposition, stent underexpansion, tissue protrusion, thrombi, stent edge dissection, and incomplete lesion coverage (Supplementary Table 2, Supplementary Figure 3). The AUC for predicting a suboptimal stenting result was significantly higher for post-PCI OFR than OCT-derived MLA in the entire interrogated vessel (0.89 vs 0.74, difference=0.15 [95% CI: 0.07-0.23], p<0.001) (Figure 3). The best cut-off value for MLA in determining post-PCI FFR ≤0.90 defined by the Youden index was 3.28 mm2.
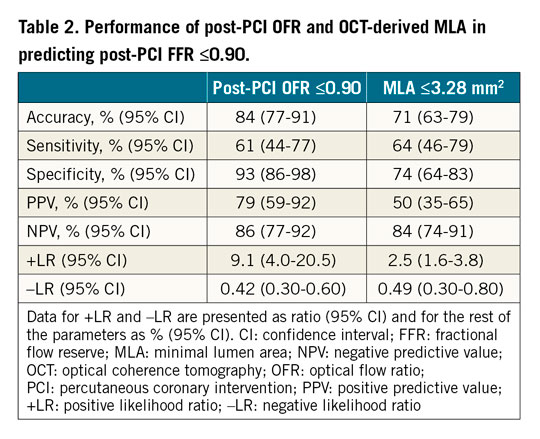
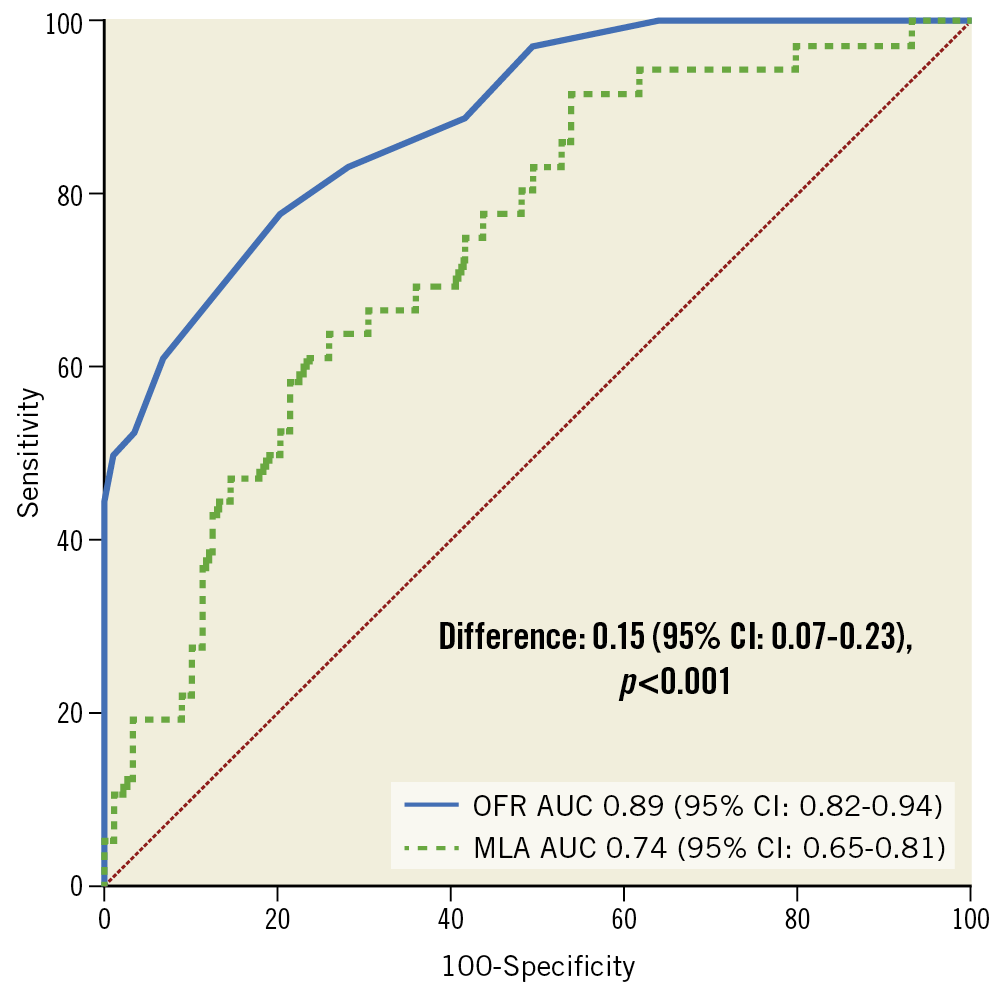
Figure 3. ROC curves for predicting post-PCI FFR ≤0.90. AUC: area under the ROC curve; MLA: minimal lumen area; OFR: optical flow ratio
INFLUENCE OF STENT EXPANSION AND APPOSITION ON IN-STENT PRESSURE DROP
In-stent OFR had a median of 0.03 [0.02-0.05]. Compared to vessels with low in-stent OFR (≤0.03), vessels with high in-stent OFR (>0.03) had significantly lower MEI (57% vs 67%, p<0.001) and higher stent malapposition (9 vs 2, p=0.003). There was significant correlation between MEI and in-stent OFR (r=–0.49, p<0.001), and weak but significant correlation between stent malapposition and in-stent OFR (r=0.27, p=0.002) (Supplementary Figure 4).
ACCURACY OF SIMULATED RESIDUAL OFR IN PREDICTING POST-PCI FFR
In 64 vessels with paired simulated residual OFR, post-PCI OFR and FFR analysis, pre-PCI OFR had a mean value of 0.74±0.08 and simulated residual OFR was 0.97±0.03. Simulated residual OFR showed moderate but significant correlation (r=0.42, p<0.001) and satisfactory agreement (mean difference=0.04±0.04, p<0.001) with post-PCI FFR (Figure 4). The correlation between simulated residual OFR and post-PCI FFR was significantly better in vessels with residual stenosis of ≥30% percent diameter stenosis (%DS) by QCA (r=0.78, p=0.003) than in the absence of residual stenosis (r=0.28, p=0.048, difference=0.50, p=0.038). The accuracy of simulated residual OFR ≤0.90 for predicting post-PCI FFR ≤0.90 was 80% (95% CI: 70-90%), with 2 true positives, 49 true negatives, 1 false positive, and 12 false negatives (Supplementary Table 3).
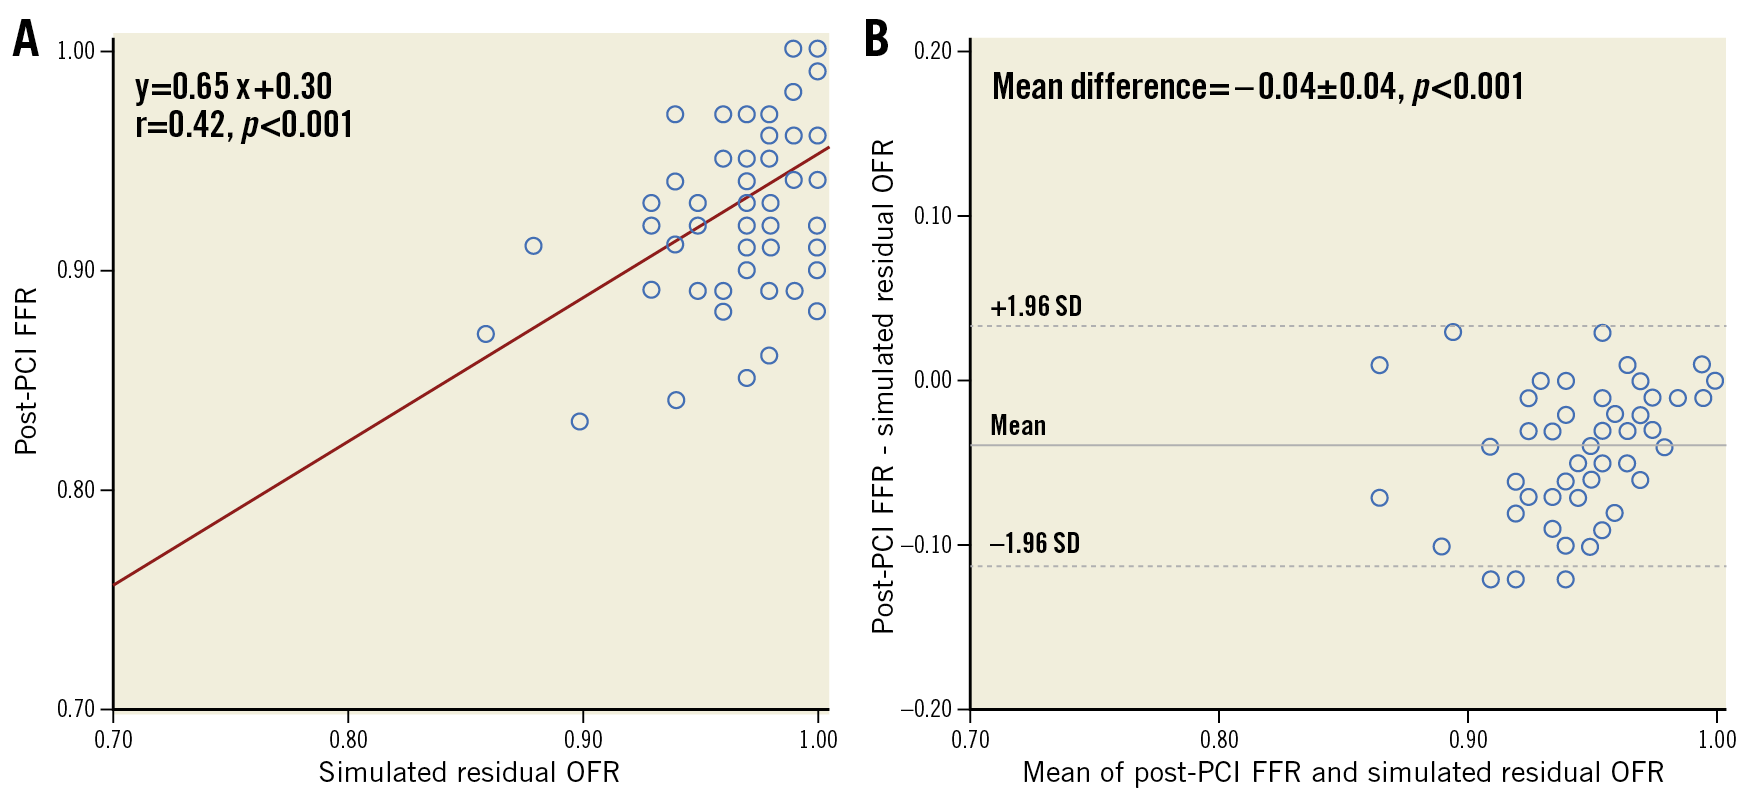
Figure 4. Correlation and agreement between simulated residual OFR and post-PCI FFR. FFR: fractional flow reserve; OFR: optical flow ratio; PCI: percutaneous coronary intervention
Discussion
The main findings of the study are summarised as follows: 1) post-PCI OFR shows good correlation and excellent agreement with post-PCI FFR; 2) the diagnostic ability of post-PCI OFR in predicting post-PCI FFR is significantly better than OCT-derived MLA; 3) simulated residual OFR shows significant correlation with post-PCI FFR and the correlation is higher in vessels with residual stenosis of ≥30% DS% by QCA; 4) the accuracy in predicting post-PCI FFR ≤0.90 is 84% for post-PCI OFR; and 5) stent underexpansion quantified by MEI significantly correlated with in-stent pressure drop derived from OFR pullback.
The present analysis represents the first attempt to investigate the accuracy of post-PCI OFR in predicting wire-based post-PCI FFR by combining data from two independent data sets. The good agreement between post-PCI OFR and FFR might be explained by two factors. First, the reference lumen size incorporating the step-down phenomenon across bifurcations was reconstructed. This contributed to more accurate reconstruction of the healthy coronary lumen and the estimated downstream flow5. Second, stent struts were automatically delineated and reconstructed in 3D, contributing to a detailed and accurate geometrical model. The good correlation between post-PCI OFR and FFR was also observed in a recent single-centre study with 103 intermediate coronary lesions undergoing successful PCI17. Of note, in post-PCI data sets, OFR and FFR values show a narrow range and skewed distribution towards normal values (Supplementary Figure 2). Although there is no consensus yet as to the ideal post-PCI functional cut-off value18, the ability of post-PCI OFR to predict post-PCI FFR ≤0.90 is clinically useful with an AUC of 0.84.
Before the advent of OFR, a coronary angiography-based computational FFR method, quantitative flow ratio (QFR), had been developed and validated with good diagnostic performance with FFR19. The comparison between OFR and QFR in de novo lesions and in-stent restenosis has been reported previously6,7. In post-PCI settings, OFR can be superior in assessing stenting results, especially in case of complex lesion types, since OCT has the advantage of a clear visualisation of essential morphological features such as stent expansion and apposition compared to angiography. The average analysis time for post-PCI OFR on each OCT pullback was reported to be 68±14 seconds17. Obtained in a short analysis time, post-PCI OFR analysis enables simultaneous evaluation of stent deployment and its physiological impact immediately after OCT imaging without additional instrumentation. Stent underexpansion and malapposition can also be correlated with virtual pressure pullback along the stented segment, providing a strong rationale for PCI optimisation.
As a novel finding, the present study reports a significant correlation between simulated residual OFR and post-PCI FFR, indicating the potential for simulated residual OFR to predict the functional PCI result by anticipating the degree of residual ischaemia after an “optimally successful” treatment of the index stenosis. In clinical practice, the ability to predict the physiological impact of PCI prior to proceeding with implantation of the selected stent length and size has several potential implications. As intracoronary imaging with OCT allows detailed morphological measurements including lesion length, reference vessel dimensions and plaque composition including calcification, simulated residual OFR could be of interest to select the best stenting landmark and reference dimensions to obtain the optimal functional result, providing an ideal post-PCI OFR target to be reached by stent implantation and optimisation. A suboptimal simulated residual OFR would indicate that the total ischaemic burden is unlikely to be optimally reduced by PCI itself, and could identify patients who may not benefit from percutaneous revascularisation. The efficacy of simulated residual OFR will be further investigated in future prospective studies enrolling patients with more complex lesions including diffuse or serial lesions.
A significant difference between post-PCI OFR and simulated residual OFR can be explained not just by residual disease outside the stented segment, but also by stent-related mechanical issues (e.g., stent underexpansion and malapposition). While simulated residual OFR assumes no pressure drop across the stented segment by virtual stenting, a residual in-stent pressure drop (median of 0.03) was present in a number of post-PCI OFR pullbacks. Therefore, simulated residual OFR will be most useful in vessels with serial lesions or diffuse disease. For target vessels without residual stenosis, simulated residual OFR will not be able to predict the post-PCI FFR result since the main pressure drop will be located in the stented segment, which cannot be simulated with the current algorithm that assumes complete revascularisation of the stented segment. In this case, assessment of post-PCI in-stent pressure drop at the stented segment will be useful to identify the cause of suboptimal stenting results18.
Severe stent underexpansion is known to induce turbulences causing in-stent pressure losses and suboptimal post-PCI FFR results2. In the DOCTORS study, the improvement in FFR by OCT-guided PCI optimisation was related mainly to the correction of stent underexpansion8. Recently, Nakamura et al15 reported significant correlation between stent expansion quantified by semi-automatic volumetric analysis and post-PCI FFR (r=0.69, p<0.001). Our study equally demonstrates a significant correlation between stent expansion and in-stent pressure drop, an essential observation that can be obtained from OCT pullback and OFR computation, without the need for wire-based instrumentation.
Limitations
This study has several limitations. The patient profiles of the pooled studies are different: the DOCTORS study only included NSTE-ACS patients versus 31% in the OxOPT-PCI study. Although failure to achieve hyperaemia in ACS patients may result in a higher FFR due to microvascular dysfunction, this effect may disappear when microvascular dysfunction recovers and appears to be of marginal clinical significance in several trials, especially when interrogating non-culprit vessels20,21,22. The differences in baseline characteristics, lesion composition, study design, and medical device used could influence the study results. However, statistical analysis showed that no centre bias existed between these two studies. Our results should be interpreted with the caveat that women only represent about 10% of the included patients. Due to the retrospective design of this study, the feasibility of post-PCI OFR computation (92.8%) was not as high as in our previous prospective study (98.7%)7, with 12 out of 167 pullbacks excluded due to insufficient image quality, mainly due to the presence of image artefacts which could impair the reliability of lumen contouring. A variable degree of mismatch may exist between the distal optical sensor and distal pressure sensor positions. This uncertainty could be a possible source of variability between post-PCI OFR and FFR. We considered the sites of distal OCT imaging and FFR measurement to be matched when there was no stenosis between the locations of both sensors. However, in practice, the FFR wire is usually located at a more distal position than the OCT catheter can be safely advanced to. In addition, pressure loss can still be seen in some non-stenotic but atherosclerotic vessels23. The assumption about matching locations might have resulted in a proportion of cases with numerically lower FFR but higher OFR values. We anticipate that these “false negative” cases will be seen less often in prospective studies and perhaps reduced with the use of OCT catheters with longer pullback length. Post-PCI measurements were not compared with follow-up data. Unlike FFR which is modulated by the downstream microcirculation and magnitude of hyperaemia, OFR partially ignores the downstream microcirculatory response. Future studies with clinical follow-up data will be useful to compare the clinical outcome guided by OFR versus FFR. Wire-based FFR pullbacks were not available in the present study; therefore, we could only investigate the correlation between stent deployment and in-stent pressure drop from OCT and OFR pullback. Of note, Emori et al in 103 intermediate coronary lesions demonstrated a mean pressure gradient of 0.04 within the stented segment by both FFR and OFR, with excellent agreement between post-PCI OFR and FFR in the stented segment (mean difference=0.00±0.02)17. Pending confirmation, it can be anticipated that our findings on the impact of stent deployment on OFR data will also be applicable to in-stent pressure drops measured by FFR.
Conclusions
Post-PCI OFR showed good correlation and excellent agreement with post-PCI wire-based FFR. Post-PCI OFR demonstrated good diagnostic concordance with post-PCI FFR. Simulated residual OFR was significantly correlated with post-PCI FFR. Stent minimum expansion index showed significant correlation with in-stent pressure drop.
|
Impact on daily practice OFR immediately after PCI provides simultaneous evaluation of coronary physiology and stent expansion and apposition within a single catheter. Simulated residual OFR could be of interest to select the best stenting landmark and reference dimensions to obtain an optimal functional result and to assess prior to PCI the likely degree of residual ischaemia after PCI. The use of both simulated residual OFR and post-PCI OFR has the potential to inform the procedural strategy, to optimise coronary interventions and to enable complete revascularisation, thereby allowing the reconciliation of precision PCI with the limitations imposed on reimbursement by healthcare systems in many geographies. |
Acknowledgements
S. Tu would like to acknowledge the support of the Natural Science Foundation of China (grant number 82020108015 and 81871460) and the National Key Research and Development Program of China.
Conflict of interest statement
W. Wijns is supported by the Science Foundation Ireland Research Professorship grant RSF 1413. He reports research grants and honoraria from MicroPort and being a medical advisor of Rede Optimus Research and co-founder of Argonauts, an innovation facilitator. A.P. Banning is partially funded by the NIHR Biomedical Research Centre Oxford. He has received an institutional grant for a fellowship from Boston Scientific, and speaker fees from Boston Scientific, Abbott Vascular and Medtronic. S. Tu has received research support from Pulse Medical Imaging Technology. The other authors have no conflicts of interest to declare.
Supplementary data
To read the full content of this article, please download the PDF.