Abstract
Aims: Multiple endpoints with varying clinical relevance are available to establish the efficacy of device-based treatments. Given the variance among blood pressure measures and medication changes in hypertension trials, we performed a win ratio analysis of outcomes in a sham-controlled, randomised trial of renal denervation (RDN) in patients with uncontrolled hypertension despite commonly prescribed antihypertensive medications. We propose a novel prioritised endpoint framework for determining the treatment benefit of RDN compared with sham control.
Methods and results: We analysed the SPYRAL HTN-ON MED pilot study data using a prioritised hierarchical endpoint comprised of 24-hour mean ambulatory systolic blood pressure (SBP), office SBP, and medication burden. A generalised pairwise comparisons methodology (win ratio) was extended to examine this endpoint. Clinically relevant thresholds of 5 and 10 mmHg were used for comparisons of ambulatory and office SBP, respectively, and therefore to define treatment “winners” and “losers”. For a total number of 1,596 unmatched pairs, the RDN subject was the winner in 1,050 pairs, the RDN subject was the loser in 378 pairs, and 168 pairs were tied. The win ratio in favour of RDN was 2.78 (95% confidence interval [CI]: 1.58 to 5.48; p<0.001) and corresponding net benefit statistic was 0.42 (95% CI: 0.20 to 0.63). Sensitivity analyses performed with differing blood pressure thresholds and according to drug adherence testing demonstrated consistent results.
Conclusions: The win ratio method addresses prior limitations by enabling inclusion of more patient-oriented results while prioritising those endpoints considered most clinically important. Applying these methods to the SPYRAL HTN-ON MED pilot study (ClinicalTrials.gov Identifier: NCT02439775), RDN was determined to be superior regarding a hierarchical endpoint and a “winner” compared with sham control patients.
Introduction
The win ratio has been introduced as a new analytical method to report composite endpoints in clinical trials1. Unlike traditional methods that consider all contributory endpoints of equal importance and by time to event rather than clinical weight, the win ratio enables prioritisation of clinical endpoints and addresses differing risk profiles among patients by using pairwise comparisons. The win ratio has recently been applied to contemporary pharmaceutical and device-based cardiovascular trials, providing an informative, readily interpretable estimate of treatment differences2,3,4,5. Given the variance among blood pressure measures and medication changes in hypertension trials, we performed a win ratio analysis of outcomes in a sham-controlled, randomised trial of renal denervation (RDN) in patients with uncontrolled hypertension despite commonly prescribed antihypertensive medications.
Methods
STUDY DESIGN
The design and primary results of the randomised, assessor- and patient-blinded, sham-controlled SPYRAL HTN-ON MED pilot study have been published previously6,7. Briefly, patients were enrolled with both systolic and diastolic hypertension with office systolic blood pressure (SBP) ≥150 and <180 mmHg, office diastolic blood pressure ≥90 mmHg, and a mean 24-hr ambulatory SBP ≥140 and <170 mmHg despite 1 to 3 commonly prescribed antihypertensive medication classes. Patients were randomised 1:1 to RDN or sham procedure to assess the primary endpoint of change in mean 24-hr ambulatory SBP at six months. Medication adherence was assessed using tandem high-performance liquid chromatography and mass spectroscopy of urine and plasma by an independent core laboratory8. All local ethics committees approved the protocol, and written informed consent was obtained from all patients. The study complied with the Declaration of Helsinki and was registered at www.clinicaltrials.gov as NCT02439775. The authors had full access to the data and take responsibility for its integrity and the data analysis.
DATA COLLECTION AND ENDPOINTS
An automatic ambulatory blood pressure monitor (Mobil-O-Graph®; IEM GmbH, Stolberg, Germany) was used to measure ambulatory blood pressure at baseline and follow-up6,9. A composite medication index was calculated for each subject based on their prescribed blood pressure reduction medication, as described in Supplementary Appendix 1,10,11.
A hierarchical endpoint was created using the following six-month endpoints and prioritised in the following order of clinical importance: 24-hr mean ambulatory SBP (ASBP), followed by office SBP (OSBP), then change in medication burden (Index):
1. ∆ASBP = 24-hr mean ambulatory systolic blood pressure change from baseline to follow-up;
2. ∆OSBP = Office systolic blood pressure change from baseline to follow-up;
3. ∆Index = Prescribed medication burden change from baseline to follow-up.
STATISTICAL ANALYSIS
The win ratio was introduced in 2012 in the setting of a cardiovascular trial for heart failure1 which extended the approach described by Finkelstein and Schoenfeld12. The win ratio method was developed in the context of time-to-event endpoints, but can be readily extended to continuous, ordinal, count, and binary endpoints13,14, which is referred to as the generalised pairwise comparisons method. The approach compares every patient randomised to RDN with every patient randomised to sham control, each time noting who “won”.
Let NR and NS be the number of patients randomised to RDN and sham control, respectively. Then one constructs all NR×NS pairs. An example is shown in Figure 1A. Because each subject can only belong to a single pair in matched comparisons and would result in subjects being excluded15, unmatched comparisons were performed to include all patients in the analysis. Each pair is then compared on the prioritised endpoint that was prospectively defined. Hypothetical blood pressure reductions are shown in Figure 1B. Beginning with ambulatory SBP, if the RDN patient has a ≥5 mmHg reduction compared with the control patient, then the RDN patient is the “winner”. If the control patient has a greater decline (≥5 mmHg) compared with the RDN patient, the control patient is the “winner”; correspondingly, the RDN patient is the “loser”. Once a winner is declared by pairwise comparison, that pair is no longer available for consideration in subsequent analyses (Figure 1C). If a pairwise comparison of ambulatory SBP results is the same (i.e., a tie), then patients are compared by the next endpoint, in this case change from baseline in office SBP (Figure 1D). Note that, if one of the patients is missing endpoint data, then that pair is automatically considered a tie since it is not possible to evaluate them; such pairs are referred to as non-informative ties. For the primary analysis, the 5 mmHg threshold was chosen based on consensus that this reduction represented a minimal goal for ambulatory SBP reduction by RDN16,17,18.
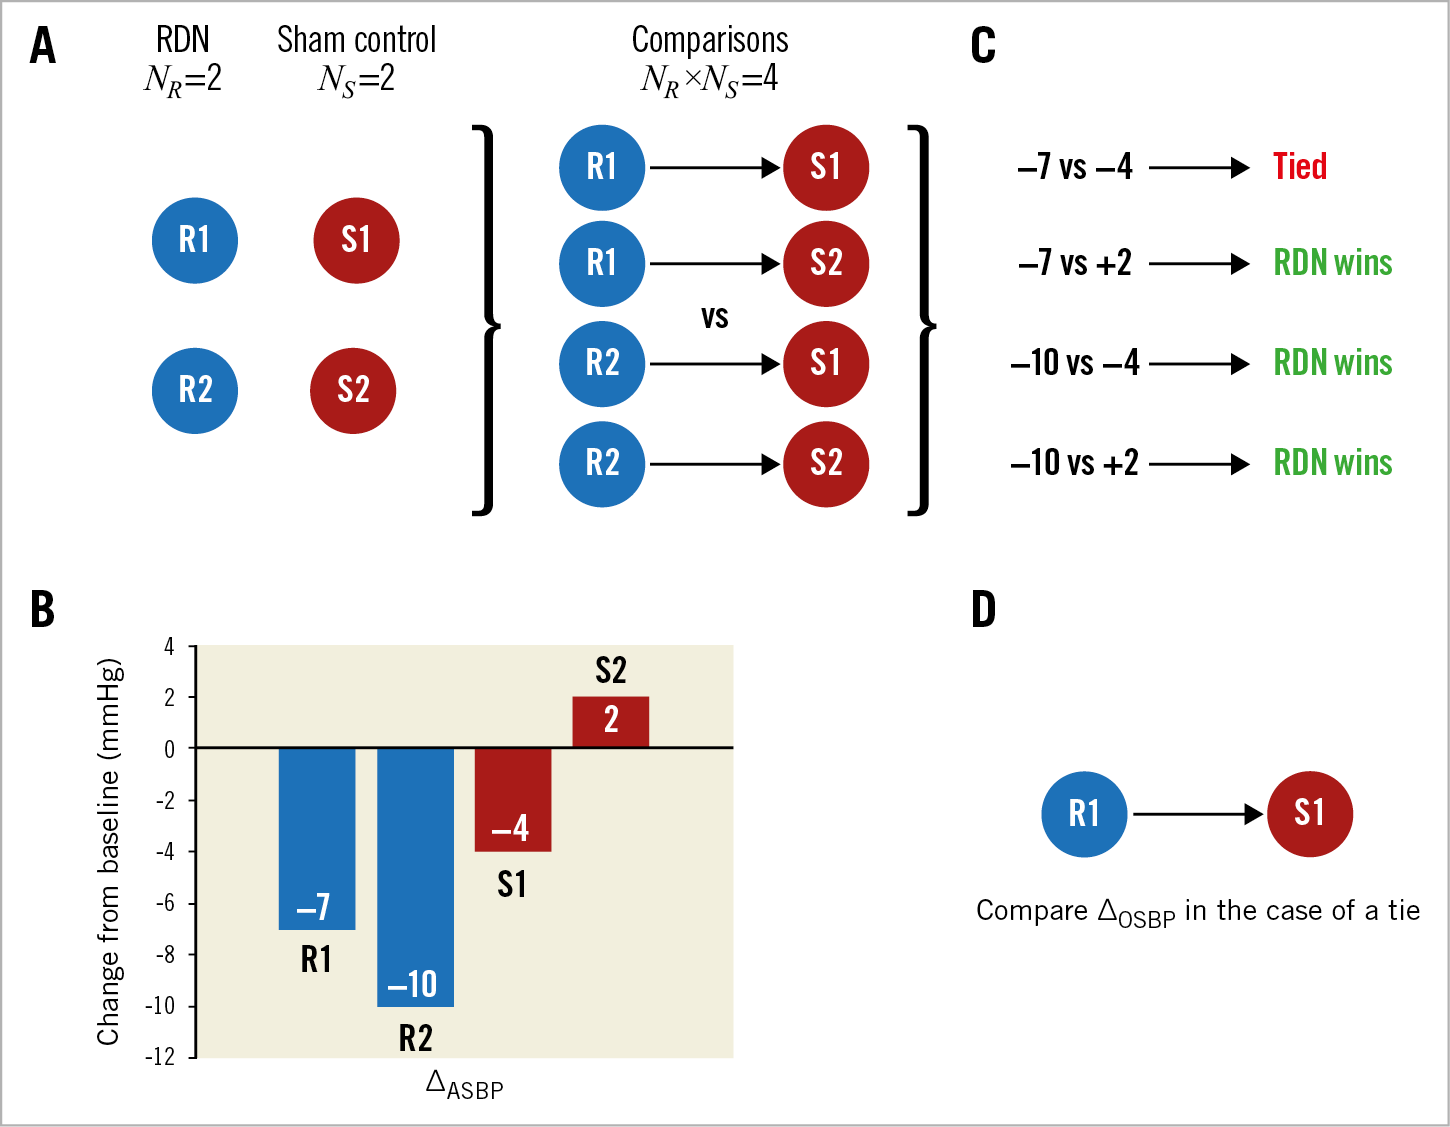
Figure 1. Conceptual illustration of the prioritised endpoints methodology involving four hypothetical subjects – two randomised to renal denervation (R1 and R2) and two randomised to sham control (S1 and S2). A) The generalised prioritised endpoints method requires each RDN subject to be compared to each sham control subject, resulting in 2×2=4 pairs. B) Hypothetical outcomes (change from baseline 24-hr mean ASBP; ∆ASBP) for each of the four subjects. C) Endpoint comparison of each subject (RDN vs sham control) and the resulting classification of the pair based on a threshold of 5 mmHg. D) For pairs that result in a tie, compare patients using the next specified endpoint, in this case change from baseline mean OSBP; ∆OSBP. ASBP: ambulatory systolic blood pressure; OSBP: office systolic blood pressure; RDN: renal denervation; NR: number of RDN patients; NS: number of sham control patients
For office SBP, a threshold of ≥10 mmHg was applied in the comparison of two subjects to declare a “winner”, a threshold also based on published consensus16,17,18. A sensitivity analysis was also performed using thresholds of 3.5 mmHg for ambulatory SBP and 6 mmHg for office SBP. For medication index, no threshold was imposed since reductions in either number or medication or dose may be clinically relevant. An additional sensitivity analysis was performed using medication index derived by drug testing analysis rather than prescription records.
Once all pairs have been considered, the numbers of winners (NW), losers (NL), and ties (NT) are tallied. Since each pair is mutually exclusive, NW+NL+NT=NR×NS. The win ratio statistic is calculated as RW=NW/NL. Calculation of a 95% confidence interval (CI) and p-value was performed using the bootstrap method (with 30,000 samples). A net benefit statistic, or proportion in favour of treatment statistic, was also calculated14. The net benefit (BW) is calculated as the difference between the number of winning pairs and the number of losing pairs divided by the total number of pairs: BW=(NW−NL)/NT. BW ranges from −1 (if the sham control arm is uniformly better than the RDN arm) to +1 (if the RDN arm is uniformly better than the sham control arm), and equals 0 if there is no net difference between the arms.
Statistical analyses were performed based on the intention-to-treat principle. R version 3.6.2 (R Foundation for Statistical Computing, Vienna, Austria) was used to perform all analyses. Analysis of covariance (ANCOVA) models adjusted for baseline blood pressure were used to estimate treatment effects separately for ambulatory and office SBP. The Wilcoxon-Mann-Whitney U test was used to compare change in medication index scores between treatment arms. The R package BuyseTest version 1.8.5 was used to calculate win ratios, CIs and p-values13. A p-value <0.05 was considered to be statistically significant.
Results
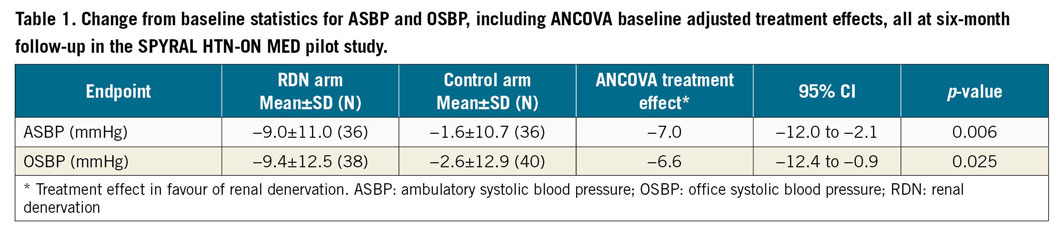
Adjusted treatment effects for both ambulatory and office SBP were statistically significant favouring RDN compared with sham control, as previously reported (Table 1). For each blood pressure endpoint, the statistical comparison was made on the basis of all data, and prescription medication data were also available on all randomised subjects at baseline and at six-month follow-up visit. In total, 13 patients had a change in prescription medication index value between baseline and six-month follow-up – 8 patients (19%) in the control arm, and 5 patients (13%) in the RDN cohort. The mean change in index was 0.13 units for the sham control group and 0.06 units for RDN patients (p=0.48). In the control group, the change in medication index ranged from −0.25 units to +2.5 units, whereas the changes ranged from −0.5 to +1.0 units among patients treated with RDN.
For the prioritised endpoints analysis, 38 RDN patients and 42 sham control patients were randomised, yielding the multiple of 1,596 pairs (Figure 2). Each pair was first evaluated for change in ambulatory SBP at six-month follow-up (with a pre-specified margin of 5 mmHg), with pairs categorised as “winners” for RDN (green boxes), “losers” (orange boxes), or “ties” (blue boxes) (Figure 2). The tied pairs were subsequently carried forward for comparison of office SBP at six-month follow-up (with a margin of 10 mmHg). Any remaining ties were finally evaluated for change in medication index between baseline and six months. Altogether, there were 1,050 pairs where the RDN subject was the winner, 378 pairs where the RDN subject was the loser, and 168 pairs that were tied on completion of the stepwise analysis (Figure 2). Missing outcome data were responsible for 300/605 ambulatory SBP ties, 76/278 office SBP ties, and 0/168 medication index ties. Accordingly, the win ratio in favour of RDN was 2.78 (95% CI: 1.58 to 5.48; p<0.001). After back-transformation, this result corresponds to a 74% (95% CI: 61% to 85%) probability (2.78 / [2.78 + 1]) of winning with RDN (conditional on not being a tie). The corresponding net benefit statistic was 0.42 (95% CI: 0.20 to 0.63).
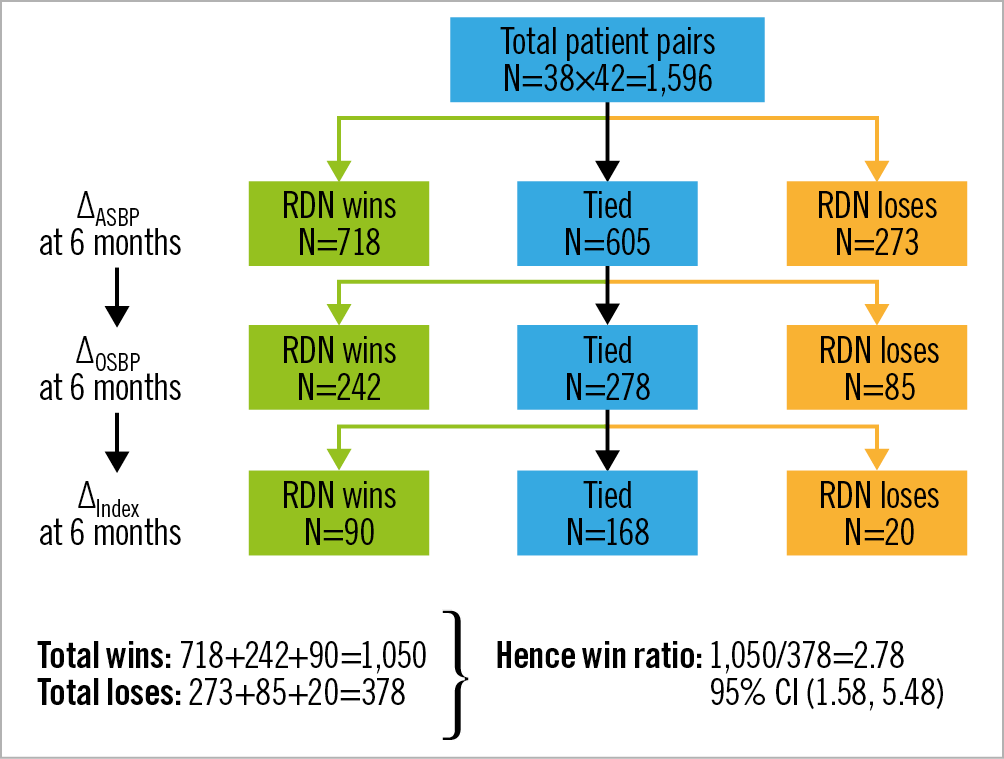
Figure 2. Win ratio analysis of the hierarchical endpoint of ∆ASBP at six months (with threshold of 5 mmHg), ∆OSBP at six months (with threshold of 10 mmHg), and ∆Index at six months (with threshold of one unit) in the SPYRAL HTN-ON MED pilot study. Every patient in the RDN arm is compared with every patient in the sham control arm. For each pair, it is determined over the six-month follow-up, first whether the RDN randomised patient “wins” or “loses” on ASBP; then, if “tied” on ASBP, whether the RDN randomised patient “wins” or “loses” on OSBP; and then, if “tied” on OSBP, whether the RDN randomised patient “wins” or “loses” on medication index. ASBP: ambulatory systolic blood pressure; OSBP: office systolic blood pressure; RDN: renal denervation
A sensitivity analysis was performed using thresholds of 3.5 mmHg and 6 mmHg for ambulatory and office SBP, respectively. In this instance, the win ratio was similar with a value of 2.67 (95% CI: 1.56 to 5.00; p<0.001). The net benefit statistic was 0.43 (95% CI: 0.21 to 0.64). In addition, the same analysis was applied when using medication index changes according to direct drug testing data versus prescription data. By this method, the win ratio was 2.43 (95% CI: 1.44 to 4.49; p=0.001).
Discussion
Emphasis on a single efficacy endpoint in device-based hypertension trials has several limitations considering clinically relevant yet different measures of blood pressure but also changes in medication dose and number. Conversely, a single composite endpoint for evaluating continuous endpoint components is unfavourable since it would require pre-specified artificial weightings, therefore underscoring the need for an alternative methodology. In the present study, the win ratio method addresses these prior limitations by enabling inclusion of more patient-oriented results while prioritising those endpoints considered most clinically important. Applying these methods to the SPYRAL HTN-ON MED pilot study6, RDN was determined to be superior regarding a hierarchical endpoint with a win ratio of 2.78 favouring RDN as the “winner” compared with sham control patients.
A novel aspect of this research is that it represents the first known application of win ratio techniques to the field of device-based hypertension treatment outcomes. Second, we have incorporated a hierarchical endpoint of multiple continuous outcomes and applied thresholds to each pairwise comparison. This approach is analogous to incorporating super-superiority margins into a prioritised endpoint framework, providing the ability to distinguish a priori clinically meaningful differences. Also with this method, generalised pairwise comparisons remain evaluable in the presence of missing data. Specifically, if there are missing data on the first component of the hierarchical endpoint, then the pair will progress to the next tier for evaluation. Traditionally, in a single endpoint comparison, subjects with missing data would usually be discarded.
The win ratio can potentially introduce efficiency to the design of a clinical trial19. Unlike conventional methods limited to composite endpoints of a single variable type, the win ratio enables analysis of composites that include time-to-event, recurrent event, continuous and/or categorical outcomes15. The impact on statistical power is complex and depends on the prioritised endpoints included in the analysis, with addition of continuous (e.g., quality-of-life measurements) and recurrent event (e.g., rehospitalisations) outcomes increasing the overall power20. Compared with larger trials involving traditional comparisons, maintenance of statistical power with smaller sample size may be achieved with lower expense3,15. Also, as demonstrated, missing data for a prioritised endpoint do not necessarily preclude the inclusion of the subject/pair at subsequent endpoint evaluations. In contrast to more common methods dependent upon time-to-first-event occurrence (e.g., Kaplan-Meier estimates, log-rank test, or Cox proportional hazards regression), the win ratio also enables assessment of multiple endpoints while permitting prioritisation of clinical endpoints that are intuitive and readily interpretable. Not only may the incidence of an event be compared, but also the time to occurrence. Finally, the win ratio can also incorporate quantitative quality-of-life scores, medication indices or other tests relevant to a therapy in addition to clinical events. As a result, the methodology has already been assimilated into prospective trial designs21. Unique to this study were three continuous endpoints - ambulatory SBP, office SBP, and medication index. Incorporating all endpoints into a single statistic as opposed to a complex multivariate (multiple outcomes) model is considered to be an advantage. In the present study, ordering of the endpoints was based on clinical justification, and the comparison thresholds used for SBP-represented measures were proposed by expert consensus16,17,18. Importantly, neither the ordering nor thresholds are fixed, such that the methodology is flexible and alternative pre-specified choices can be used. Moreover, there is no restriction on the selection of endpoints to be examined; for example, additional endpoints of interest may include reduction in diastolic blood pressure. The choice of medication index used was based on pragmatic data reduction arguments, seeking a way to balance number of medications together with their class type, prescribed dose, and standard dose. Notably, several alternative medication indices are available, including the defined daily dose22. Even the number of prescribed medications may be considered, although this model probably represents an oversimplification of change in medication burden since it neglects change in dose.
As experience grows with the win ratio method, the methodology described and illustrated herein should be considered as an additional supplementary endpoint analysis or even as a primary analysis for future trials in device-based hypertension treatment. Moreover, this methodology presents an additional perspective for both interpretation of clinical benefit and to inform shared decision making. In the former instance, the win ratio can also be translated to a probability likelihood: if the win ratio is 2.78 in the current study, then the probability that the RDN patient wins compared with sham control is 74% (2.78 / [2.78 + 1]). In a population of patients with similar enrolment criteria to ON MED, explanations of probability of benefit and outcome are especially relevant to individual patient preference. If renal denervation is efficacious, then a patient may prefer a blood pressure reduction with commensurate decline in medication burden, especially if the medication has undesirable side effects or if medication adherence is challenging. Not only can the win ratio be considered as a measure of relative benefit, but also the net benefit can be considered an absolute measure and summarise the treatment effect for all endpoints. Further, the prioritised endpoint methodology employed in this study may be generalised to allow for repeated measures. For example, medication burden assessment separately at both six and 12 months provides an extensible opportunity to analyse the long-term durability of RDN therapy. This method may therefore be especially relevant to device-based hypertension trials since medication changes per protocol are typically not allowed until later time points. Finally, the methodology can be used to assess a mixture of different endpoint types, such as inclusion of both a continuous endpoint (e.g., change from baseline in ambulatory SBP) and a binary endpoint (e.g., office SBP <140 mmHg at follow-up).
Limitations
A limitation of this analysis is that, despite demonstration of statistically significant blood pressure reductions with RDN in the SPYRAL HTN-ON MED pilot trial6, performance of the win ratio analyses is based on a limited study population. Also, unlike time-to-event outcomes (e.g., death more important than rehospitalisation), establishing the clinical priority of endpoints for continuous measures may be more ambiguous in a device-based hypertension study15. Notwithstanding this, the endpoint components, ordering, and any thresholds to be applied were reported and clinically justified prospectively in a statistical analysis plan, although this was a post hoc analysis and the study was not designed and powered for this kind of approach. Further, despite protocol recommendations for medication changes to improve blood pressure control, such changes were performed at the treating physician’s discretion and therefore may either overestimate or underestimate differences when considering patient preference and adherence. However, results were consistent in the present study when limited to actual drug adherence by testing. Longer-term follow-up regarding medication changes may amplify potential differences; however, later results were not included in the present study since control patients were permitted by protocol to cross over to RDN. Finally, the win ratio method does not account for the regression to the mean phenomenon23. Extensions to correct for this might include the use of residuals or stratified win ratio statistics, which represents an area of future research specific to this methodology.
Conclusions
The win ratio analysis allows utilisation of several endpoints in a prioritised way to assess the efficacy of device-based hypertension treatments such as renal denervation. This novel approach addresses the limitation of single endpoint measurements for efficacy and may be particularly important for assessment of long-term efficacy. When applied to the SPYRAL HTN-ON MED pilot study data to address both blood pressure and medication changes, the win ratio method demonstrates unequivocal benefit for RDN compared with sham control.
|
Impact on daily practice Multiple endpoints with varying clinical relevance are available to establish the efficacy of device-based treatments. The win ratio method outlined in this paper enables inclusion of patient-oriented results while prioritising those endpoints considered most clinically important. Applying these methods to the SPYRAL HTN-ON MED pilot study, RDN was determined to be superior regarding a hierarchical endpoint and a “winner” compared with sham control patients. |
Acknowledgements
The principal investigators and trial steering committees designed the protocol in conjunction with the sponsor. Jessica Dries-Devlin, PhD, CMPP, and Beth Ferri, PhD, CMPP, both of Medtronic, provided editorial support. Vanessa DeBruin, MS, and Sandeep Brar, MD, provided trial design expertise and manuscript review.
Funding
This work was supported by Medtronic.
Conflict of interest statement
D. Kandzari reports institutional research/grant support from Medtronic and Ablative Solutions, and personal consulting honoraria from Medtronic. G. Hickey, S. Cohen, M. Fahy, and G. Lamberti are employees and shareholders of Medtronic. S. Pocock reports consultant fees from Medtronic outside the submitted work. M.A. Weber reports personal fees from Medtronic, Ablative Solutions, ReCor, and Boston Scientific, all outside the submitted work. M. Böhm reports personal fees from Amgen, Bayer, Servier, Medtronic, Boehringer Ingelheim, Vifor, Bristol Myers Squibb, and AstraZeneca, all outside the submitted work. F. Mahfoud is supported by Deutsche Gesellschaft für Kardiologie (DGK), and Deutsche Forschungsgemeinschaft (SFB TRR219) and has received scientific support and speaker honoraria from Bayer, Boehringer Ingelheim, Medtronic and ReCor Medical.
Supplementary data
To read the full content of this article, please download the PDF.