Abstract
Aims: The aim of this study was to assess the prognostic implications of increased right ventricle volume index (RVVI) using cardiac-gated computed tomography angiography (CCTA) data among patients undergoing transcatheter valve replacement (TAVR).
Methods and results: CCTA of 323 patients who underwent TAVR at Stanford University Medical Center (CA, USA) and Tel Aviv Medical Center (Israel) between 2013 and 2016 was analysed by an automatic four-chamber volumetric software and grouped into quartiles according to RVVI. Higher one-year mortality rates were noted for the upper quartiles – 5%, 4.9%, 8.6%, and 16% (p=0.039), in Q1 <59 ml/m2, Q2 59-69 ml/m2, Q3 69-86 ml/m2, and Q4 >86 ml/m2, respectively. However, the differences were not significant after propensity score adjustments. Sub-analyses of Q1 demonstrated an escalating risk for one-year mortality in concordance to RVVI: HR 2.28, HR 2.76, and HR 4.7, for the upper 25th, 15th, and 5th percentiles, respectively (p<0.05 for all comparisons). After propensity score adjustments for clinical and echocardiographic characteristics, only the upper 5th percentiles (RVVI >120 ml/m2) retained statistical significance (HR 2.82, 95% CI: 1.02-7.78, p=0.045). Notably, 68.7% of patients from this group were considered low-intermediate risk for surgery.
Conclusions: Cardiac volumetric data by CCTA performed for procedural planning may help to predict outcome in patients undergoing TAVR.
Introduction
Over the last decade, transcatheter aortic valve replacement (TAVR) has emerged as the treatment of choice in patients with severe aortic stenosis (AS) and prohibitive surgical risk1,2,3,4,5. Moreover, recent trials have reported promising results even in low surgical risk patients6,7. However, clinical experience proves that some patients die relatively soon after the procedure8. Currently, there are no validated methods for selection of suitable candidates. It had been suggested that patients with right heart failure as a late sequela of left side valve disease are at an increased risk for adverse outcomes9,10,11,12,13,14. The assessment of right heart function is routinely performed by echocardiography, yet volumetric analysis by echocardiography, particularly right heart volumes, may not always be accurate15,16,17,18. Cardiac computed tomography angiography (CCTA) is the mandatory pre-interventional imaging modality for patients who are eligible for TAVR. The same imaging study may provide added information, such as cardiac volumetric assessment19,20. In the present study we used an automatic four cardiac chamber volumetric analysis (4CVA) of CCTA to calculate the RV size in patients undergoing CCTA prior to TAVR in two tertiary medical centres. We postulated that 4CVA of CCTA may contribute to risk stratification in pre-TAVR patients.
Methods
STUDY DESIGN AND PATIENT SELECTION
Between January 2013 and March 2016 patients with severe symptomatic native AS (aortic valve area <1 cm2) who underwent TAVR at one of two medical centres – Stanford University Medical Center (Stanford, CA, USA) and Tel Aviv Sourasky Medical Center (TASMC; Tel Aviv, Israel) – were included in the study. Clinical details were prospectively recorded for all patients at baseline and at one-year follow-up. Echocardiographic and CT data were recorded at baseline prior to the procedure. The study protocol was approved by the institutional review boards in both centres. The requirement for informed consent was waived due to the retrospective nature of the study.
CCTA ACQUISITION
Retrospectively gated CCTA was performed with a second-generation dual-source CT scanner (SOMATOM® Definition Flash; Siemens Healthineers, Erlangen, Germany) at Stanford University Medical Center (n=152) or with a 256×0.625 mm detector row scanner (iCT 256; Philips Healthcare, Amsterdam, the Netherlands) in TASMC (n=171). At Stanford University Medical Center, the cardiac gated chest scan began in the thoracic outlet, and ended at the diaphragm, followed by non-gated abdominal scans which were acquired with contrast injections of 60-110 mL (1.2 mL/kg) of iodinated contrast material at a concentration of 300 mg iodine per mL (Iopamidol; Bracco, Princeton, NJ, USA) at an injection rate of 4-5 mL/sec. In TASMC, scans were acquired with contrast injections of 40-70 mL (0.8 mL/kg) of iodinated contrast material at a concentration of 300 mg iodine per mL (Iomeron; Bracco, Milan, Italy) at an injection rate of 4-5 mL/sec. CT scanning was initiated using an automated bolus triggering five seconds after the attenuation in the ascending aorta reached a threshold of 100 Hounsfield units covering the heart from the tracheal bifurcation to the diaphragm. When an abdominal aortic scan was included in the same acquisition, the scan began at the tracheal bifurcation and ended at the femoral arterial bifurcation level, and the injected volume was 60-110 mL (1.2 mL/kg). Data were reconstructed at a slice thickness of 0.8 mm or 0.75 mm, with an increment of 0.4 mm. Measurements of the aortic annulus were carried out during the systolic phase scan (35% or 40% of the R to R interval), while all automated volumetric analysis assessments were carried out on a mid-diastolic phase scan (75% of the R to R interval) which is considered the phase with the least motion artefacts20. When significant variability in the heart rate was observed, ECG editing was performed immediately following the scan acquisition, and the images used for the annular measurements (at the systolic phase) and the volumetric assessment (at mid-diastolic phase– 75% of the new edited R to R interval) were used.
VOLUMETRIC ANALYSIS OF THE CARDIAC CHAMBERS
Automated volumetric measurements of the RV, right atrium (RA), left ventricle (LV) and the left atrium (LA) were obtained using a fully automatic software (Comprehensive Cardiac Analysis, IntelliSpace, Portal Version 6; Philips Healthcare, Cleveland, OH, USA). The algorithm adapts an anatomical model of the heart chambers to the CT image volume20,21,22. The output of the volumetric analysis consisted of a three-dimensional (3D) graphic display of the heart segmented into its main structures. We analysed the volumes of the RV, RA, LV and LA. The volume of each cardiac chamber was automatically calculated as the product of a single voxel volume and the sum of all voxels was included in it. The software allows the relevant segmentation structure to be colour-coded and viewed simultaneously in both 3D and 2D superimposed on the reference image in the axial, coronal, sagittal, or cardiac views (short-axis, vertical long-axis, horizontal long-axis). Each structure was inspected visually on the reference images for conformity to the imaged cardiac anatomy in order to validate the correctness of the segmentation. In cases where the automatic segmentation was visually assessed as incorrect, the chamber’s volumetric data were excluded from the study (42 out of 365 patients). Manual tools for correction of the volumetric segmentation are available but were not used in the present study. Volumes were indexed to body surface area and reported as volume indices (ml/m2). Figure 1 shows an example of the automated segmentation output of a patient with an enlarged RV who died within one year.
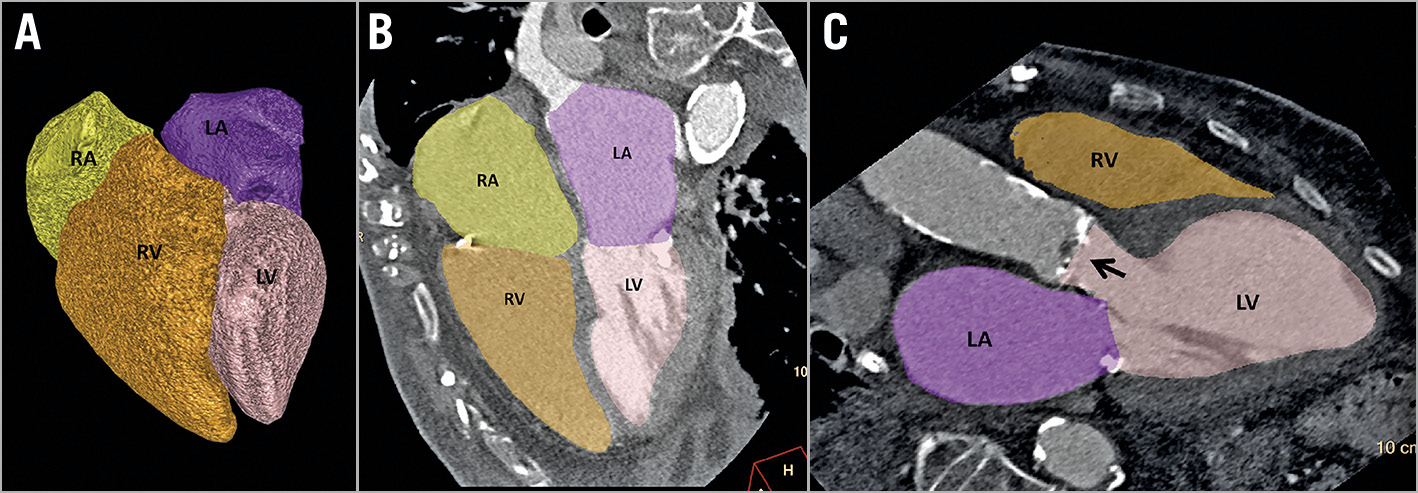
Figure 1. Output example of the fully automated four-chamber volumetric analysis of the pre-TAVR cardiac CT angiography showing an enlarged right ventricle (right ventricular volume index=127.4 mL/m2). A) Volumetric model of the four cardiac chambers. B) Vertical long-axis reformation (four-chamber view). C) Oblique (three-chamber view). Arrow showing the calcified aortic valve. Colour code: left atrium=purple, left ventricle=pink, right atrium=yellow, and right ventricle=orange. LA: left atrium; LV: left ventricle; RA: right atrium; RV: right ventricle
STATISTICAL ANALYSIS
Categorical variables were expressed as percentages. Distribution of continuous variables was assessed using a histogram and Q-Q plot and expressed as median and interquartile range (IQR). A cubic non-linear regression was used to present the relation between RV volume indices and one-year mortality. Each volume was correlated to the corresponding average of observed events (i.e., percentages of one-year mortality) on the y-axis. The trend line was formed according to the eventual estimated non-linear cubic relation. The reference line was set by the overall mean mortality. RV volume indices were divided into quartiles and compared to the lower quartile with regard to mortality risk. Cox regressions were used to assess the relation between RV size and one-year mortality. Hazard ratios (HRs) and 95% confidence intervals (CIs) were reported. A sub-analysis of the higher quartile was then performed to evaluate cut-offs at which RV volume is independently associated with one-year mortality. Propensity scores were used to adjust for baseline characteristics (age, gender, body mass index [BMI], hypertension, diabetes mellitus, hyperlipidaemia, peripheral vascular disease, coronary artery disease, prior myocardial infarction, prior coronary artery bypass graft, prior valve surgery, permanent pacemaker, atrial fibrillation, cerebrovascular accident [CVA]/transient ischaemic attack [TIA], renal dysfunction, dialysis, chronic obstructive pulmonary disease [COPD], New York Heart Association [NYHA] Class IV, Society of Thoracic Surgeons [STS] score), the medical centre at which the TAVR was performed, and echocardiographic parameters (interventricular septum, left ventricle ejection fraction, aortic valve area index, aortic valve gradients, left atrial volume index [LAVI], E/e, E/A, systolic pulmonary artery pressure, mitral regurgitation). A two-tailed p<0.05 was considered statistically significant. All statistical analyses were performed with SPSS, Version 22 (IBM Corp., Armonk, NY, USA).
Results
BASELINE CHARACTERISTICS
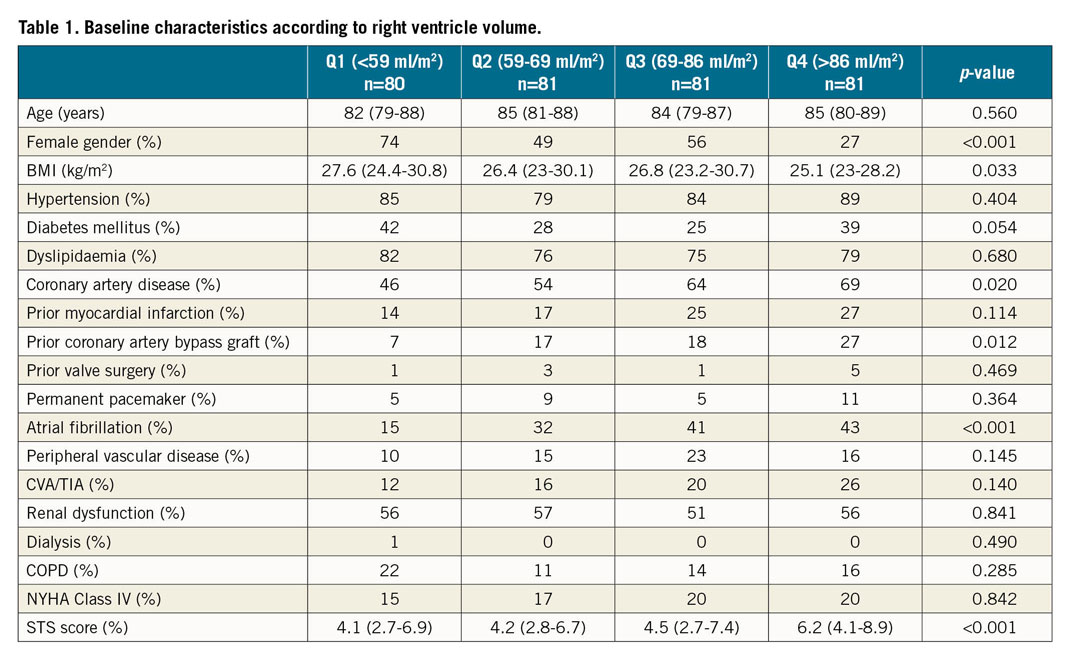
The cohort consisted of 323 patients, 152 from Stanford University School of Medicine and 171 from Tel Aviv Medical Center. The median age was 84 (IQR 80-88) years, the median STS score was 4.8% (IQR 3-7.4), and 51.4% were of female gender. Baseline characteristics according to a division into quartiles of RV volumes (Q1 <59 ml/m2, Q2 59-69 ml/m2, Q3 69-86 ml/m2, Q4 >86 ml/m2) are presented in Table 1. Patients within the upper quartiles demonstrated lower BMIs, a higher number of females, and higher STS scores. A higher prevalence of ischaemic heart disease (coronary artery disease and prior coronary artery bypass graft) and atrial fibrillation was noted in the upper quartiles of RV volumes. The remaining comorbidities, as well as the NYHA class, did not differ statistically across the groups. A low-intermediate (STS <8%) preprocedural surgical risk was estimated in 86.2%, 87.7%, 80.2%, and 70.3% of patients within Q1, Q2, Q3, and Q4, respectively (Supplementary Table 1).
CT AND ECHOCARDIOGRAPHY
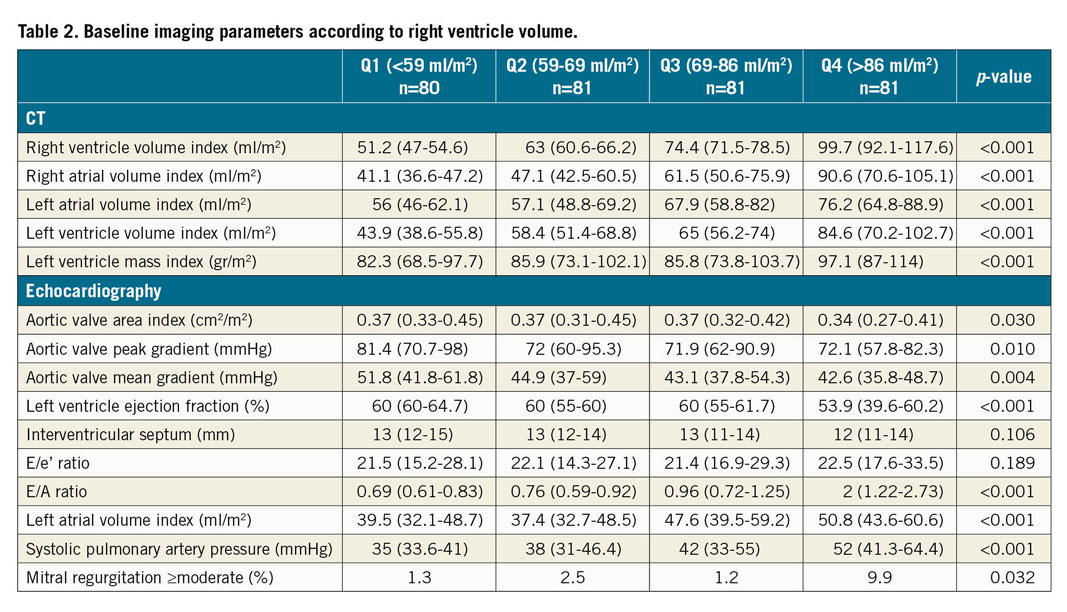
Baseline imaging parameters according to RV volume are presented in Table 2. Echocardiography was available for 273 patients. Patients within the upper quartiles presented with larger volumes of all cardiac chambers by CT. Echocardiography demonstrated reduced systolic and diastolic function in the upper quartile of RV volumes, according to LV ejection fraction, E/A ratio, LAVI, and systolic pulmonary artery pressure. Aortic valve area indices were lower and aortic valve gradients (peak and mean) were higher in the upper quartiles of RV volumes. In addition, mitral regurgitation of moderate degree or above was more prevalent in the upper quartile of RV volumes.
MORTALITY
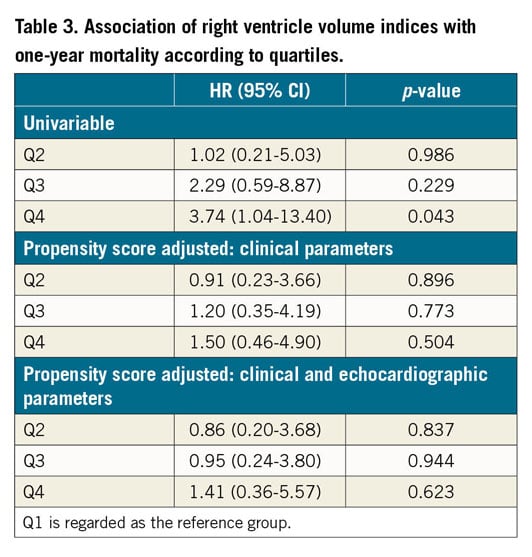
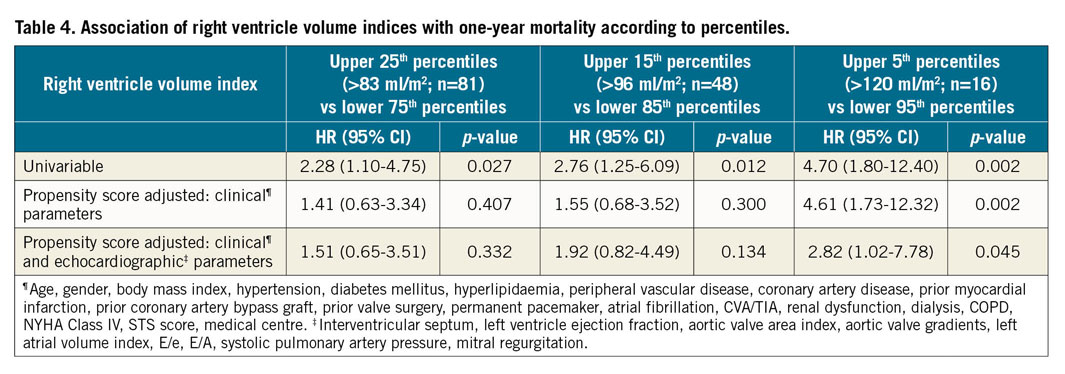
At one year, 28 patients (8.7%) from the entire cohort had died. There were no significant differences in 30-day mortality between the groups – 2.5%, 2.5%, 3.7%, 3.7% (p>0.999) in Q1, Q2, Q3, Q4, respectively. The relation between right ventricle volume indices and one-year mortality is presented in Figure 2. At one year, a significantly increased mortality rate was noted for the upper quartiles – 5%, 4.9%, 8.6%, 16% (p=0.039), in Q1, Q2, Q3, Q4, respectively. In a univariable analysis (Figure 3), the upper quartile of RV volumes was associated with increased mortality compared to the lower quartile (HR 3.74, 95% CI: 1.04-13.40, p=0.043). Adjustments for baseline characteristics with propensity scores eliminated the differences (p>0.5) (Table 3). Sub-analyses of Q1 – upper 25th percentiles (>83 ml/m2; n=81) versus lower 75th percentiles, upper 15th percentiles (>96 ml/m2; n=48) versus lower 85th percentiles, and upper 5th percentiles (>120 ml/m2; n=16) versus lower 95th percentiles – demonstrated escalating hazard ratios for one-year mortality in concordance to RV volumes: HR 2.28 (95% CI: 1.10-4.75, p=0.027), HR 2.76 (95% CI: 1.25-6.09, p=0.012), and HR 4.7 (95% CI: 1.80-12.4, p=0.002), respectively. However, after adjustments for clinical and echocardiographic characteristics (Table 4) with propensity scores, only the upper 5th percentiles of RV volumes retained statistical significance (HR 2.82, 95% CI: 1.02-7.78, p=0.045).
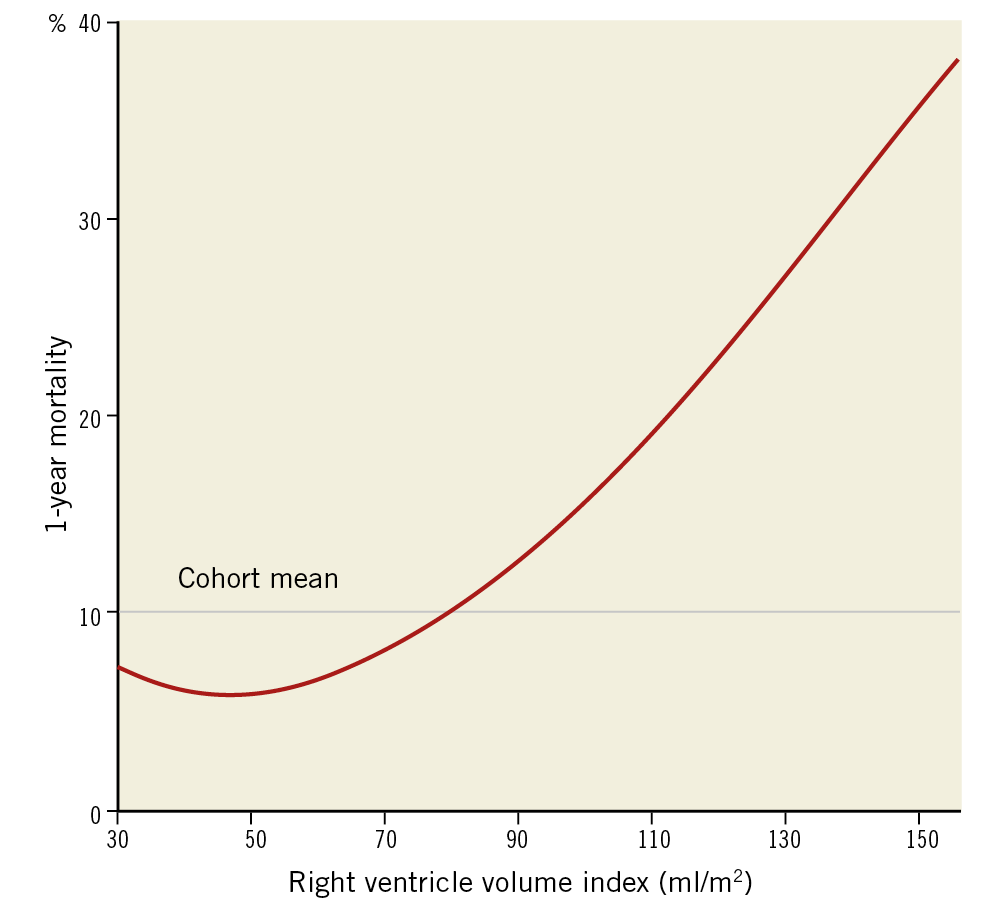
Figure 2. Relation between right ventricle volume indices and one-year mortality.
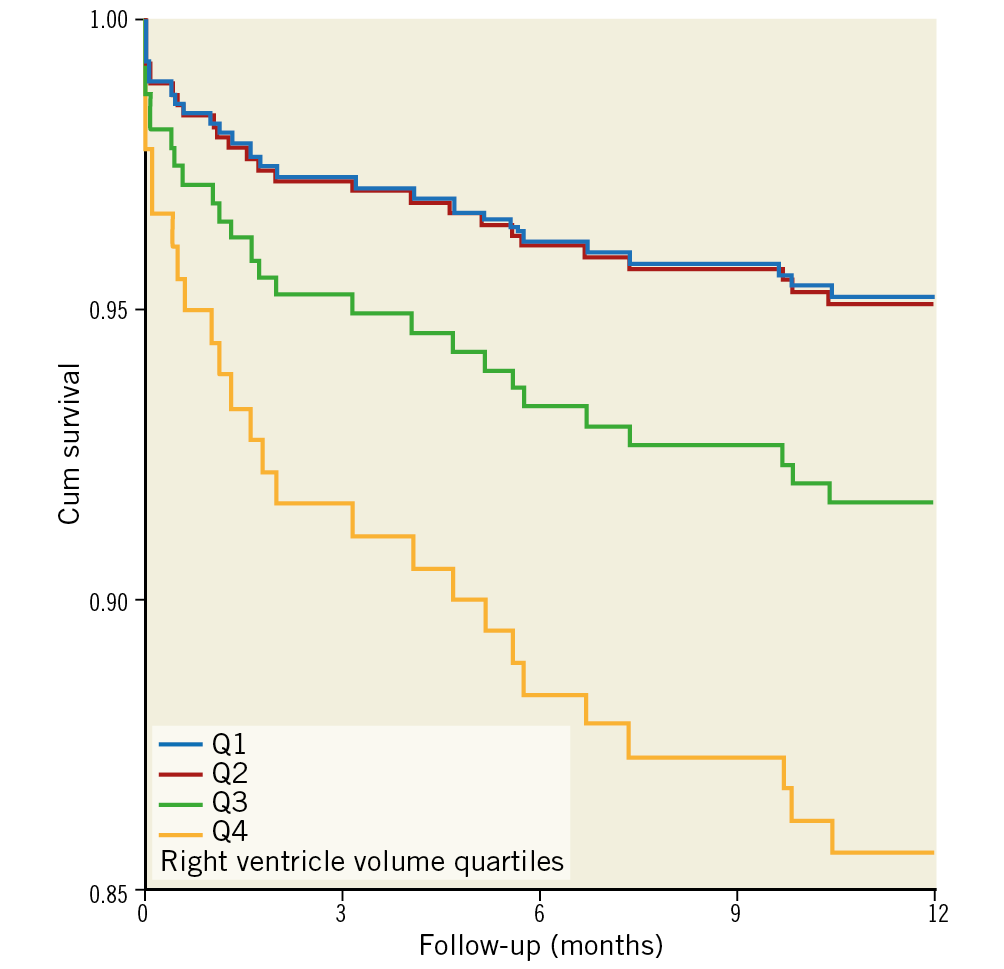
Figure 3. Cox survival curves according to right ventricle volume index.
Discussion
This is a two-centre retrospective analysis of patients undergoing TAVR due to severe AS. The principal finding is that larger RV volume, which was automatically calculated based on volumetric analysis of CCTA, is associated with higher mortality at one year following the procedure, and thus may contribute to risk stratification and predict outcome of patients undergoing TAVR. Notably, approximately 70% of patients with a large RV were considered low-intermediate risk for surgery.
Our results are in line with the current literature, showing that patients with RV enlargement who undergo left-sided valve interventions have poor outcomes23, and reduced one-year survival rates12. Right chamber dilatation may occur in patients with AS because of pressure overload from increased left-sided filling pressures and pulmonary artery pressures transmitted to the right side, volume overload from fluid retention or concomitant tricuspid regurgitation, or ventricular interdependence23,24. Therefore, it is not surprising that RV dysfunction is a not uncommon finding and is associated with adverse outcomes9,10,11,12,13,14. As expected, in the present cohort patients with dilated RV had increased pulmonary artery pressure. However, even after adjustment for systolic pulmonary artery pressure (estimated by echocardiography), as well as left side filling pressures and ejection fraction, dilated RV by CT remained an independent predictor of outcome. Thus, in patients with severe RV dilatation, the insult of the left-to-right haemodynamic cascade might signify irreversibility; RV recovery does not consistently ensue after TAVR.
A conspicuous difference between the groups which should be addressed is the distribution of gender. It is postulated that females carry a better prognosis following TAVR25. Nevertheless, gender disparities were adjusted for in the propensity scores. Likewise, the potential anatomical inequalities were accounted for, by providing volume indices (volume per body surface area).
Previous studies were almost exclusively based on echocardiography. Right heart volume quantification by echocardiography is known to be limited due to the chamber’s complex anatomy14,15,16,17,18. Currently, there is no precise geometric model which accounts for the volumetric assumptions of the RV, particularly among patients with fluid overload16. Measurements may differ significantly at various distances between the tricuspid annulus and the apex17,26. Consequently, it is recommended that the right heart should be imaged from multiple acoustic windows; therefore, the report is dependent on a subjective interpretation of the acquired images by the echocardiographer. Moreover, while in certain instances it may be difficult to detect mild abnormalities in RV size17, it has been shown that volumes tend to be overestimated at certain ranges but underestimated in others15.
We chose to use the fully automated algorithm of the 4CVA for RV volume determination while refraining from corrections with manual tools, in order to emphasise its advantages of easy and fast provision of highly valuable information. This software was designed to identify the various cardiac compartments based on a pre-learned anatomical model, thus enabling efficient workflow by automated cardiac chamber volume calculation. The output of the automated calculations was compared with the results from intensive labour manual segmentation and found to be accurate and highly reproducible20. Certainly, most post-processing platforms do offer tools which allow assessment of the RV volumes manually or with semi-automated tools. However, developing strategies that can reliably transform complex visual observations into well-defined algorithmic procedures is an active area of exploration that can enhance clinical practice. Other studies have shown that objectivity, reproducibility, and sensitivity are often improved when characterisations are based upon computer-aided analyses27.
Limitations
There are several limitations that must be taken into consideration. First, the study is retrospective. Such a design may introduce inherent biases. Second, the high-risk population, i.e., the upper 5th percentile of RV volume, consisted merely of 16 patients, thereby limiting the power of the analysis. Third, volumes were measured at 75% of diastole due to the lowest presence of motion artefacts; therefore, they do not represent end-diastole. In a trade-off between minimising inaccuracies of the segmentation and determining the true end-diastole volumes, the former prevailed. Furthermore, these methods were consistent for all patients; previous studies used a similar approach20,28. Thin-slice end-diastolic images were not available for our retrospective analysis. Finally, since estimation of RV size with echocardiography is limited in certain cases, such data were not collected; therefore, a volumetric comparison for validation purposes was not performed.
Conclusions
In the current study, we used objective, non-operator-dependent CT data, which were freely available from the already acquired preprocedural CCTA. Our findings demonstrate that RV enlargement is associated with increased one-year mortality among patients with severe AS undergoing TAVR, regardless of the preprocedural surgical risk. We thus believe that utilising data from the CCTA which are used for procedural planning can be beneficial, and can contribute to clinical decision making and setting expectations with patients and their families.
|
Impact on daily practice The presented data demonstrate that cardiac volumetric data by CCTA performed for procedural planning may help to predict outcome in patients undergoing TAVR and identify patients who are at high risk for adverse outcomes despite having a low preprocedural surgical risk. |
Conflict of interest statement
A. Finkelstein receives proctor fees from Medtronic and Edwards Lifesciences. G. Aviram’s institution receives a research grant from Philips Healthcare, unrelated to the present study. The other authors have no conflicts of interest to declare.
Supplementary data
To read the full content of this article, please download the PDF.