


Abstract
Knowledge about long-term risk factors and the prevalence of heart failure stages in general population is limited. We aimed to study the prevalence of cardiac dysfunction and heart failure in 71-year-old men and potential risk factors in the past two decades.
This research was based on a randomized selected population study with longitudinal follow-up.
A random sample of men born in 1943 in Gothenburg, Sweden were examined in 1993 (at 50 years of age) and re-examined 21 years later in 2014 (at 71 years of age). Cardiac dysfunction or heart failure was classified into four stages (A–D) according to American Heart Association/American College of Cardiology guidelines on heart failure.
Of the 798 men examined in 1993 (overall cohort), 535 (67%) were re-examined in 2014 (echo cohort). In the echo cohort 122 (23%) men had normal cardiac function, 135 (25%) were at stage A, 207 (39%) men were at stage B, 66 (12%) men were at stage C, and five (1%) men were at stage D. Multivariable logistic regression demonstrated that elevated body mass index at 50 years old was the only independent risk factor for developing heart failure/cardiac dysfunction during the subsequent 21 years. For each unit (1 kg/m2) of increased body mass index, the odds ratio for stages C/D heart failure vs no heart failure/stage A increased by 1.20 (95% confidence interval, 1.11–1.31, p < 0.001), after adjustment for smoking, sedentary life style, systolic blood pressure, diabetes, and hyperlipidemia.
In a random sample of men at 71 years of age, half presented with either cardiac dysfunction or clinical heart failure. High body mass index was associated with an increased risk for developing cardiac dysfunction or heart failure over a 21-year period.
Introduction
Heart failure (HF) continues to be a major public health problem associated with high mortality and morbidity.1,2 The disease is a progressive disorder that begins with risk factors for cardiac dysfunction, proceeds to asymptomatic changes in cardiac structure and function, and then evolves into clinically overt HF, disability, and death.3,4 In recognition of the importance of this concept, the American College of Cardiology (ACC) and the American Heart Association (AHA) proposed guidelines to identify four stages (A–D) in the progression of HF.4
Neither the prevalence of HF stages nor determinants of long-term risk have been adequately studied in an elderly general population. In an era when people in general live longer, evaluation of the long-term risk of HF is essential in that both the risk of cardiovascular disease and competing risks (e.g. death from non-cardiovascular causes) during the life course have to be considered. In the Framingham Heart Study the lifetime risk of HF was one in five for both men and women.5 Hypertension, obesity, and diabetes are major risk factors that can be modified,6 as can the risk of coronary heart disease, which is another major precursor of HF. The available studies on the prevalence of cardiac dysfunction are either conducted in a previous era or from selected samples in the USA.5–8 Data from contemporary European populations with HF verified by echocardiography during two decades-long follow-up are lacking.
Therefore, our study aimed first to estimate the prevalence of HF stages in Swedish men at 71 years of age from a randomly selected general population and, second, to determine the risk factors for developing cardiac dysfunction (stage B) and HF (stages C and D) during a 21-year follow-up.
Methods
Study population
This substudy is part of “The study of Men Born in 1943,” a longitudinal, prospective population-based study of middle-aged men.9 Briefly, in 1993, a randomly selected sample of half of all men born in 1943 (thus all were 50 years of age) and living in the city of Gothenburg, Sweden was invited to participate. Of 1463 men invited, 798 (55%) accepted the invitation and underwent a health examination at entry. Participants still living in Sweden were invited to repeated examinations in 2003 and 2014 (Supplementary Material Appendix Figure 1). Outcome events and comorbidity data were collected through the Swedish Inpatient Registry and the Swedish National Death Registry. In addition, self-reported comorbidity data were collected at the 1993, 2003, and 2014 examinations. In addition, medical records from 1993–2014 were manually reviewed. The Gothenburg Regional Research Ethics Board approved the study and written informed consent was obtained from each participant.
Data collection
At the 1993 and 2014 examinations, a clinical examination and laboratory analyses were performed. On both occasions, information on lifestyle, family history, medical history, and smoking habits was obtained through a questionnaire. Participants who had quit smoking >3 months before the examination were considered non-smokers. Physical activity during leisure time was self-rated and assessed with the four-grade Saltin Grimby Physical Activity Scale (SGPALS)10 graded as 1 = sedentary, 2 = some light physical activity, such as walking, riding a bicycle and light gardening for at least four hours a week, 3 = regular moderate physical activity for a minimum of three hours a week and 4 = regular intense physical training for competition sports. Grades 2–4 were grouped into one category defined as an active lifestyle while grade 1 was defined as a sedentary life style.
Blood pressure was recorded with the participant in a sitting position using a mercury sphygmomanometer. Body mass index (BMI) was calculated as weight in kilograms divided by height in meters squared and analyzed both as a continuous variable and as a categorical variable, defined by the following categories: <22.5, 22.5–24.99, 25–27.49, 27.5–29.99, ≥30 kg/m2. Obesity was defined as a BMI ≥ 30 kg/m2. Standard 12-lead electrocardiogram (ECG) examinations were recorded with the participants at rest in the supine position. Hypertension was defined as systolic blood pressure (BP) ≧ 140 mm Hg or diastolic BP ≧ 90 mm Hg or having active treatment with antihypertensive medication. Diabetes mellitus was defined as fasting glucose >7 mmol/l or if the participant was on active treatment with anti-diabetes medication. Hyperlipidemia was defined as a total cholesterol level >6.2 mmol/l or active treatment with lipid-lowering medication.
In 2014, in addition to the above-mentioned examinations, an echocardiographic investigation was performed (Vivid 7, General Electric, Horten, Norway) with the following parameters measured: interventricular septal thickness, left ventricular (LV) end-diastolic dimension. LV posterior wall thickness, LV ejection fraction and left atrial area, the peak velocity flow in early diastole (E wave), deceleration time of the E wave, peak velocity flow in late diastole caused by atrial contraction (A wave), the E/A ratio and early diastolic mitral valve annular velocity (e′) at the septal site. The E/e′ ratio was calculated as an estimate of LV filling pressure or of a restrictive LV filling pattern.
Classification of HF stages in the echo cohort
Patients were classified according to the guidelines defined by the ACC/AHA4 into four stages of HF or cardiac dysfunction in 2014 when they were all 71 years of age.
Stage 0: Healthy persons, without any HF risk factors.
Stage A: Persons at high risk of developing HF and presence of at least one of the HF risk factors, but with no identifiable cardiac structural or functional abnormality. Risk factors included hypertension, diabetes mellitus, coronary artery disease, and obesity.
Stage B: Abnormal heart structure or dysfunction but without signs or symptoms of HF. Structural heart disease was defined as clinical or echo abnormalities, including (a) a history of myocardial infarction; (b) LV hypertrophy based on LV mass index ≥115 g/m2, according to recommendations of the American Society of Echocardiography (ASE),11 where the LV mass was calculated using the formula proposed by Devereux et al.12 and indexed to body surface area; (c) LV enlargement or the LV end-diastolic dimension (LVEDD) index calculated as LVEDD/body height (cm/m) ≥3.4 in men;13 LV systolic dysfunction being an LV ejection fraction (EF) <50% and diastolic dysfunction according to recommendations of the ASE.14
Stage C: Manifestation of HF and New York Heart Association (NYHA) functional classes II–III.
Stage D: Advanced HF and NYHA functional class IV.
Overall cohort
For all men in the overall cohort (all 798 men examined at baseline), information about HF diagnosis was obtained from the Swedish Inpatient Registry and the Swedish National Death Registry. All hospitalizations and causes of death with International Statistical Classification of Diseases and Related Health Problems (ICD) codes 428 (ICD-9) or I50 and I11.0 (ICD-10) were classified as HF (stage C/D).
Statistical analysis
Descriptive statistics and results are presented as the number (n), percentage (%), mean with standard deviation (SD), odds ratio (OR), and 95% confidence interval (CI).
Baseline characteristics were compared in different HF stage groups and different BMI categories in the echo cohort using the Kruskal-Wallis test (continuous variables) and chi-square tests (categorical variables), in the overall cohort, baseline characteristics were compared between HF and non-HF group using the Mann-Whitney U-test (continuous variables), Fisher's exact test (dichotomous variables) and Mantel-Haenszel chi-square test (ordered categorical variables). Univariable and multivariable logistic regression analyses were performed to determine the impact of risk factors on overall cohort for HF vs no HF, and on echo cohort for stage B vs no HF/stage A, stage C/D vs no HF/stage A and stage B/C/D vs no HF/stage A. Covariates were all baseline variables, which were significantly different as shown in Table 1 and clinically important including smoking, BMI, systolic BP, hyperlipidemia, a sedentary lifestyle, and diabetes. Beside the linear effects, non-linear effects were examined employing splines for continuous variables.
Baseline characteristics, measured in 1993 at 50 years of age, as well as mean body mass index (BMI) in 2003 and in 2014. Data presented in relation to different heart failure (HF) stages among 535 men investigated at 71 years of age (echo cohort) and 798 men investigated at 50 years of age (overall cohort) and followed up for 21 years.
| Echo cohort | Overall cohort | |||||||
|---|---|---|---|---|---|---|---|---|
| HF stage | Normal (n = 110) | Stage A (n = 147) | Stage B (n = 207) | Stage C/D (n = 71) | p-Value | Non-HF (n = 706) | HF (n = 92) | p-Value |
| Clinical characteristics: Smoking habit Never smoker, n (%) | 44 (40.0) | 41 (27.9) | 83 (50.1) | 21 (29.6) | 0.130 | 234 (33.1) | 24 (26.1) | 0.396 |
| Previous smoker, n (%) | 36 (32.7) | 65 (44.2) | 80 (38.6) | 28 (39.4) | 256 (36.3) | 37 (40.2) | ||
| Current smoker, n (%) | 30 (27.3) | 41 (27.9) | 44 (21.3) | 22 (31.0) | 216 (30.6) | 31 (33.7) | ||
| Sedentary lifestyle, n (%) | 12 (10.9) | 27 (18.4) | 17 (8.2) | 12 (16.9) | 0.024 | 107 (15.2) | 18 (19.6) | 0.286 |
| BMI in 1993, kg/m2 | 24.3 ± 2.3 | 26.5 ± 3.2 | 26.0 ± 2.8 | 27.8 ± 3.8 | <0.001 | 26.0 ± 3.3 | 28.0 ± 4.0 | <0.001 |
| BMI in 2003, kg/m2 | 25.0 ± 2.8 | 27.6 ± 3.7 | 26.9 ± 3.2 | 28.3 ± 3.9 | <0.001 | 26.7 ± 3.7 | 28.4 ± 4.0 | <0.001 |
| BMI in 2014, kg/m2 | 25.1 ± 2.6 | 27.8 ± 4.2 | 27.1 ± 3.7 | 28.5 ± 4.2 | <0.001 | 26.9 ± 3.8 | 28.5 ± 4.1 | <0.001 |
| Waist circumference, cm | 90.7 ± 6.7 | 95.9 ± 8.8 | 94.0 ± 8.3 | 98.8 ± 10.2 | <0.001 | 94.5 ± 9.2 | 99.2 ± 10.7 | <0.001 |
| Heart rate, bpm | 65.5 ± 10.3 | 67.4 ± 11.6 | 63.9 ± 11.9 | 65.2 ± 13.6 | 0.056 | 67.0 ± 12.2 | 67.5 ± 13.3 | 0.746 |
| Systolic BP, mm Hg | 117.8 ± 9.5 | 132.2 ± 15.1 | 127.1 ± 16.4 | 131.6 ± 17.7 | <0.001 | 128.0 ± 16.6 | 134.4 ± 20.2 | 0.007 |
| Diastolic BP, mm Hg | 77.5 ± 7.0 | 86.9 ± 9.3 | 83.2 ± 10.7 | 86. 5 ± 10.1 | <0.001 | 84.0 ± 10.6 | 87.3 ± 10.2 | 0.006 |
| Medical history: Hypertension, n (%) | 0 (0) | 80 (54.4) | 74 (35.7) | 34 (47.9) | <0.001 | 269 (38.1) | 47 (51.1) | 0.054 |
| Hyperlipidemia, n (%) | 36 (32.7) | 47 (32.0) | 76 (36.7) | 25 (35.2) | 0.793 | 260 (36.8) | 37 (40.2) | 0.300 |
| Atrial fibrillation, n (%) | 0 (0) | 3 (2.2) | 0 (0) | 2 (2.8) | 0.178 | 7 (1.0) | 2 (2.2) | 0.280 |
| Diabetes, n (%) | 0 (0) | 4 (2.9) | 4 (1.9) | 3 (4.2) | 0.189 | 22 (3.1) | 7 (7.6) | 0.067 |
| Stroke, n (%) | 0 (0) | 0 (0) | 0 (0) | 1 (1.4) | 0.088 | 1 (0.1) | 1 (1.1) | 0.218 |
| Laboratory findings: Cholesterol, mmol/l | 5.7 ± 1.0 | 5.8 ± 1.0 | 5.9 ± 1.1 | 5.8 ± 1.0 | 0.170 | 5.9 ± 1.0 | 6.0 ± 1.1 | 0.544 |
| Triglycerides, mmol/l | 1.3 ± 0.5 | 1.7 ± 1.0 | 1.6 ± 1.0 | 1.8 ± 1.2 | <0.001 | 1.6 ± 1.1 | 2.0 ± 1.5 | 0.126 |
| NT-pro-BNP, pg/ml | 28.5 ± 30.7 | 30.0 ± 35.7 | 29.4 ± 34.0 | 49.7 ± 63.4 | 0.001 | 38.7 ± 33.1 | 64.9 ± 53.0 | 0.001 |
| Creatinine, μmol/l | 91.94 ± 8.9 | 93.2 ± 9.9 | 90.7 ± 10.1 | 90.8 ± 9.7 | 0.115 | 91.1 ± 10.3 | 90.9 ± 9.6 | 0.829 |
BP: blood pressure; NT-pro-BNP: N-terminal pro-brain natriuretic peptide.
A failure analysis of baseline data was performed comparing the echo cohort with the non-survivors and men alive but not re-examined in 2014.
Statistical analyses were performed using IBM SPSS statistics (v. 22; IBM Corp., Armonk, New York, USA); the level of significance was set at 0.05 and all p and CI values were two-sided.
Results
The longitudinal overall cohort includes 798 men examined in 1993. During follow-up, one man underwent sex reassignment surgery and, consequently, was excluded from the cohort, 121 (15.2%) died during follow-up, 23 (2.9%) emigrated and were lost to follow-up, one had a secret address and could not be contacted and 117 (14.7%) were invited but either did not respond or declined re-examination. One man was unwilling to participate in the echo examination. The final sample examined with echocardiography in 2014 was 535 men (echo cohort). Supplementary Material Appendix Figure 1 displays the flow chart of the echo cohort in the study.
Prevalence of HF stages
In the echo cohort 122 (22.8%) men were classified as stage 0 HF, 135 (25.2%) as stage A, 207 (38.7%) as stage B, 66 (12.3%) as stage C, and five (0.9%) as stage D. Of the 71 men who developed clinical HF (stage C and D), 24 (33.8%) had HF reduced ejection fraction (HFrEF) while 47 (66.2%) had HF preserved ejection fraction (HFpEF).
In the overall cohort of those who died (n = 121), 15 (12%) had known HF. Among those examined with echocardiography in 2014 (n = 535), 71 had HF (66 in stage C and five in stage D). Of those who survived but declined examination in 2014 (n = 117), six had been hospitalized for HF. Thus, 92 (11.5%) men were diagnosed with HF.
Baseline characteristics in 1993
Clinical characteristics and participant risk profiles by stage of HF in both the echo and the overall cohort in 1993 are listed in Table 1. At baseline, in 1993, only 6.3% of the participants were taking antihypertensive drugs, while 52.2% of the study population were on treatment with antihypertensive medication in 2014 at 71 years of age. Overall, in both cohorts participants in the more advanced stages of HF had a higher BMI, a larger waist circumference, higher systolic and diastolic BP, higher levels of N-terminal pro-brain natriuretic peptide (NT-pro-BNP) at baseline.
Risk factors for the development of stage B and C/D
Risk factors for the development of stage C/D were examined in the overall cohort and stage B, C/D, and B/C/D in the echo cohort.
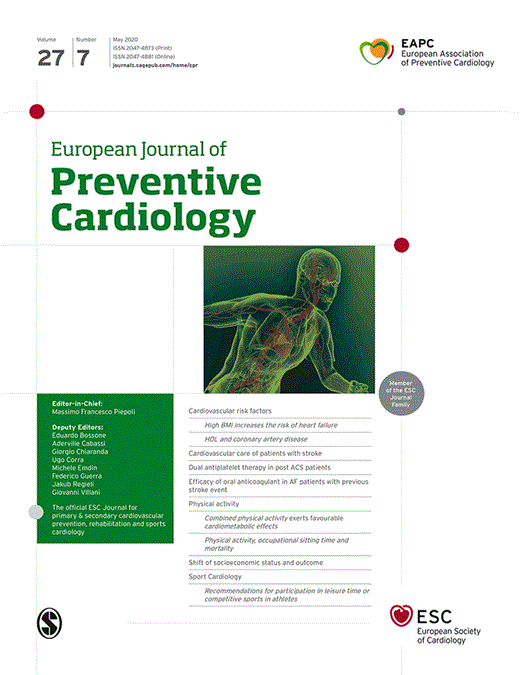
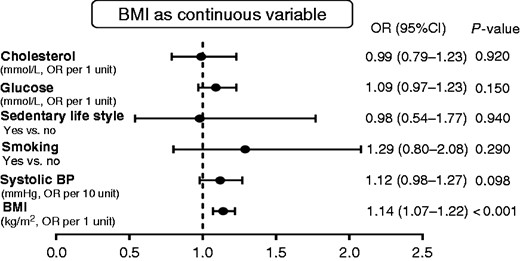
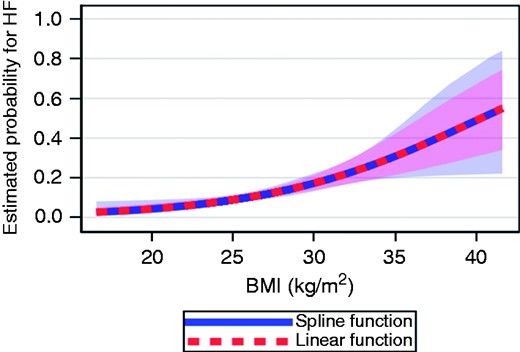
In the overall cohort, as depicted in Figure 1, after including smoking, systolic blood pressure, glucose, total cholesterol, and sedentary lifestyle in a multivariable logistic regression model, BMI in 1993 was the only risk factor that predicted HF after 21 years of follow-up for stage C/D (clinical HF). With each unit (1 kg/m2) of increased BMI, the risk for HF was increased by 14% (OR, 1.14; 95% CI, 1.07–1.22, p < 0.001). In Figure 2, BMI was modelled as a continuous variable according to a spline function confirming a strong association between body weight and risk of clinical HF. With BMI < 22.5 (set as the reference group), men with a BMI ≥30 had an OR of 3.01 (95% CI, 1.18–7.70, p = 0.021) for developing HF (Figure 3).
Risk for heart failure based on body mass index(BMI) as a continuous variable in the overall cohort. BP: blood pressure; CI: confidence interval; OR: odds ratio.
Splines showing the probability of heart failure (HF) based on body mass index (BMI) as a continuous variable in the overall cohort.
Risk for heart failure based on body mass index (BMI) as a categorical variable in the overall cohort. CI: confidence interval; OR: odds ratio.
In the echo cohort, risk factors for those with stage B (heart dysfunction), stage C/D (clinical HF), and combined stage B/C/D (heart dysfunction and HF) were analyzed separately (Table 2). When participants with clinical HF (stages C/D) were excluded, BMI was not associated with subsequent cardiac dysfunction (stage B, p for trend = 0.12). When considering stage B, C, and D vs normal+group A, a multivariable logistic model, adjusted for smoking, hypertension, diabetes, hyperlipidemia, and a sedentary lifestyle, revealed that BMI in 1993 was the only significant risk factor for subsequent HF (stages C/D) (p for trend = 0.002). The similarly adjusted analysis for clinical HF (group C/D and excluding group B) confirmed the strong association between BMI and HF (p < 0.001). With each unit (1 kg/m2) of increased BMI, the OR was 1.20 (95% CI, 1.11–1.31, p < 0.001) for stages C/D and 1.10 (95% CI, 1.03–1.16, p = 0.002) for stages B/C/D when compared with no HF/stage A.
Comparison of the 21-year risk of heart failure (stage B, stages C/D and stages B/C/D with normal + stage A) in 798 men from the general population 50 years of age at baseline.
| A. Stage B | ||||||
| No. at risk | No. at different stage | Unadjusted | Adjusted | |||
| OR (95% CI) | p | OR (95% CI) | p | |||
| Stage B vs normal + stage A | ||||||
| BMI: | ||||||
| <22.5 | 58 | 20 | 1.00 | 1.00 | ||
| 22.5–24.99 | 138 | 67 | 1.79 (0.95–3.39) | 0.072 | 1.84 (0.97–3.50) | 0.061 |
| 25–27.49 | 148 | 60 | 1.30 (0.69–2.44) | 0.423 | 1.36 (0.71–2.59) | 0.356 |
| 27.5–29.99 | 81 | 44 | 2.26 (1.13–4.53) | 0.022 | 2.35 (1.15–4.81) | 0.019 |
| ≥30 | 39 | 16 | 1.32 (0.57–3.05) | 0.514 | 1.39 (0.57–3.53) | 0.470 |
| p For trend | 0.118 | |||||
| Smoking: | ||||||
| No | 168 | 83 | 1.00 | 1.00 | ||
| Yes | 296 | 124 | 0.74 (0.51–1.08) | 0.118 | 0.71 (0.48–1.05) | 0.083 |
| Sedentary lifestyle: | ||||||
| No | 408 | 190 | 1.00 | 1.00 | ||
| Yes | 56 | 17 | 0.50 (0.27–0.91) | 0.024 | 0.88 (0.28–1.02) | 0.052 |
| Diabetes: | ||||||
| No | 458 | 203 | 1.00 | 1.00 | ||
| Yes | 6 | 4 | 2.51 (0.46–13.85) | 0.290 | 2.10 (0.35–11.38) | 0.430 |
| Hyperlipidemia: | ||||||
| No | 305 | 131 | 1.00 | 1.00 | ||
| Yes | 159 | 76 | 1.22 (0.83–1.79) | 0.319 | 1.019 (0.80–1.78) | 0.393 |
| Hypertension: | ||||||
| No | 308 | 133 | 1.00 | 1.00 | ||
| Yes | 156 | 74 | 1.19 (0.81–1.75) | 0.384 | 1.22 (0.81–1.85) | 0.342 |
| B. Stages B/C/D | ||||||
| No. at risk | No. at different stage | Unadjusted | Adjusted | |||
| OR (95% CI) | p | OR (95% CI) | p | |||
| Stages B/C/D vs normal + stage A | ||||||
| BMI | ||||||
| <22.5 | 63 | 25 | 1.00 | 1.00 | ||
| 22.5–24.99 | 151 | 80 | 1.71 (0.94–3.11) | 0.078 | 1.75 (0.96–3.21) | 0.068 |
| 25–27.49 | 164 | 76 | 1.31 (0.73–2.37) | 0.367 | 1.36 (0.75–2.48) | 0.315 |
| 27.5–29.99 | 101 | 64 | 2.63 (1.38–5.02) | 0.003 | 2.65 (1.37–5.13) | 0.004 |
| ≥30 | 56 | 33 | 2.18 (1.05–4.52) | 0.037 | 2.18 (1.00–4.75) | 0.050 |
| p For trend | 0.002 | |||||
| Smoking: | ||||||
| No | 189 | 104 | 1.00 | 1.00 | ||
| Yes | 346 | 174 | 0.84 (0.56–1.19) | 0.324 | 0.76 (0.53–1.10) | 0.151 |
| Sedentary lifestyle: | ||||||
| No | 476 | 203 | 1.00 | 1.00 | ||
| Yes | 68 | 75 | 0.65 (0.39–1.09) | 0.102 | 0.60 (0.35–1.03) | 0.062 |
| Diabetes: | ||||||
| No | 526 | 271 | 1.00 | 1.00 | ||
| Yes | 9 | 7 | 1.39 (0.68–-16.00) | 0.139 | 2.61 (0.52–-13.05) | 0.243 |
| Hyperlipidemia: | ||||||
| No | 351 | 177 | 1.00 | 1.00 | ||
| Yes | 184 | 101 | 1.20 (0.84–1.71) | 0.326 | 1.15 (0.80–1.67) | 0.460 |
| Hypertension | ||||||
| No | 345 | 170 | 1.00 | 1.00 | ||
| Yes | 190 | 108 | 1.36 (0.975–21.94) | 0.094 | 1.24 (0.85–1.81) | 0.264 |
| C. Stage C/D | ||||||
| Stages C/D vs normal + stage A | ||||||
| BMI | ||||||
| <22.5 | 43 | 5 | 1.00 | 1.00 | ||
| 22.5–24.99 | 84 | 13 | 1.39 (0.46–4.19) | 0.557 | 1.42 (0.47–4.32) | 0.534 |
| 25–27.49 | 104 | 16 | 1.38 (0.47–4.04) | 0.555 | 1.36 (0.46–4.01) | 0.573 |
| 27.5–29.99 | 57 | 20 | 4.11 (1.40–12.09) | 0.010 | 3.82 (1.28–11.42) | 0.016 |
| ≥30 | 40 | 17 | 5.62 (1.82–17.28) | 0.003 | 4.54 (1.41–14.58) | 0.011 |
| p For trend | <0.001 | |||||
| Smoking: | ||||||
| No | 106 | 21 | 1.00 | 1.00 | ||
| Yes | 222 | 50 | 1.18 (0.66–2.09) | 0.557 | 1.01 (0.55–1.84) | 0.981 |
| Sedentary lifestyle: | ||||||
| No | 277 | 59 | 1.00 | 1.00 | ||
| Yes | 51 | 12 | 1.13 (0.56–2.31) | 0.722 | 0.94 (0.44–1.99) | 0.864 |
| Diabetes: | ||||||
| No | 323 | 68 | 1.00 | |||
| Yes | 5 | 3 | 5.63 (0.92–34.34) | 0.061 | 2.08 (0.31–13.82) | 0.451 |
| Hyperlipidemia: | ||||||
| No | 220 | 25 | 1.00 | 1.00 | ||
| Yes | 108 | 46 | 1.14 (0.66–1.98) | 0.644 | 1.09 (0.61–1.96) | 0.781 |
| Hypertension§: | ||||||
| Yes | 212 | 34 | 1.00 | 1.00 | ||
| No | 116 | 37 | 1.96 (1.15–3.35) | 0.014 | 1.37 (0.76–2.47) | 0.300 |
CI: confidence interval; OR: odds ratio.
Discussion
The main findings of this study were that: (a) half of the men in the study had either cardiac dysfunction (stage B) or clinical HF (stage C/D) by the age of 71 years and (b) high BMI was the only independent risk factor for the development of either heart dysfunction or HF over a span of 21 years.
The distribution of HF stages in our study is similar to that reported in previous reports.3,15 For instance, in residents of Olmsted County (Minnesota, USA; aged ≥ 45 years) 32% had neither HF risk factors nor structural heart diseases (stage 0), 22% had stage A, and 34% had stage B.3 Similarly, in 739 participants in a Portuguese population health survey, 19% of the men and 26% of the women were at stage 0 while 54% of the men and 44% of the women were at stage A.15 In our study, we reported a higher prevalence of stage B (39%) and a lower prevalence of stage 0 (23%). There are three possible explanations for the discrepancy: (a) the mean age in our study is older than in previous studies and thus there is a higher likelihood of structural heart diseases or dysfunction; (b) echocardiography was performed in our study but not in the others, which allows an objective evaluation of heart dysfunction; and (c) in our study HF was defined according to the latest HF guidelines, which differs from previous studies that used either the Framingham criteria16,17 or older versions of diagnostic criteria for HF.18,19
Even though moderate activity has been demonstrated to be protective,20 we were unable to confirm this, possibly because of limited power. Also the Framingham study found a one-unit increase in BMI was associated with an increased risk of HF in both men and women,21 but the effect of BMI as a specific risk factor for developing cardiac dysfunction was not addressed. This is a highly clinically relevant issue given that HF is a progressive condition usually preceded by cardiac dysfunction3,4 before clinical HF becomes manifest. The adverse effects of obesity on myocardial structure and function have recently been reviewed,22 and it was found that the consequences of obesity on myocardial structure and function likely contribute to the increased prevalence of HF in obese individuals. Echocardiographic examinations of participants after the 21-year follow-up in our study allowed us to determine the contributing roles of all traditional risk factors for the development of cardiac dysfunction (stage B) with or without overt HF (stages C/D). Thus, our results contribute valuable public health-care information by showing that, over a lengthy period, high BMI is an independent risk factor for subsequent HF (stages C/D) or cardiac dysfunction (stage B) but not for cardiac dysfunction alone (stage B).
A perplexing issue concerns why only high BMI was associated with an increased long-term risk for HF among all the well-known risk factors (diabetes, hypertension, smoking, hyperlipidemia, and physical inactivity). Possible explanation is that over the follow-up period of more than two decades, some risk factors (such as hypertension) might have been successfully treated or modified, whereas obesity is notoriously difficult to treat. More than every second participant was on antihypertensive medication at 71 years of age. Another explanation may be the limited sample size in our study in combination with a relatively low prevalence of diabetes and atrial fibrillation compared to other study populations. However, maintaining a healthy body weight seems to be an important preventive measure to lower HF risk in a middle-aged general male population.
Our findings on the prevalence of HF staging are not only relevant for clinicians but also important for the community in that they demonstrate that at least half of this elderly population had cardiac dysfunction, with another 25% presenting with risk factors for HF. With increasing life expectancy, the absolute numbers of older people with HF will increase at an alarming rate in developed countries. In addition, in successive cohorts of men at 50 years of age we have previously shown that the prevalence of obesity increased three-fold, from 6% in 1963 to 19% in 2013.23 Accordingly, obesity-associated HF will probably increase dramatically in the future, stressing the importance of promoting measures to prevent obesity and weight gain in middle age.
Strengths and limitations
Our study had several strengths: (a) a random sample of men from the general population; (b) a homogeneous population with respect to age; (c) a prospective longitudinal follow-up over 21 years; and (d) cardiac function objectively verified by echocardiography. However, there were also limitations: this was a comparatively small study sample, and only men of the same age with a similar ethnic background were considered, so that our conclusions cannot be generalized to other populations including women and other age groups.
Conclusions
In this 71-year-old sample of men from a random general population, half had either heart dysfunction or clinical HF. Increased BMI was the only independent risk factor for developing HF over a 21-year span. Maintaining a healthy body weight seems to be the most important public health action to prevent HF in a middle-aged general population of men.
Author contribution
POH, MF, and AR contributed to the conception or design of the work. XC analyzed the data and drafted the article. ET, YZ, CE, ZM, and KC collected the data and revised the text critically for important intellectual content. All authors gave final approval and agree to be accountable for all aspects of the work ensuring integrity and accuracy.
Acknowledgements
The abstract of this manuscript was accepted as a poster presentation entitled ‘Less than half of men aged 71 in a general population have normal heart function: a prospective longitudinal 21-year follow-up’ at the ESC Congress 2017, Barcelona, Spain, 28 August 2017. The authors are grateful to all the staff for their support over the years and to all participating men.
Declaration of conflicting interests
The author(s) declared no potential conflicts of interest with respect to the research, authorship, and/or publication of this article.
Funding
The author(s) disclosed receipt of the following financial support for the research, authorship, and/or publication of this article: This work was supported by the Swedish Heart-Lung Foundation, the Swedish Research Council (SIMSAM), the Swedish agreement between the government and the county councils concerning economic support for providing an infrastructure for research and education of doctors and the Regional Development Fund, Västra Götaland County, Sweden (FOU-VGR). Clinical trial registration: The study is registered on ClinicalTrials.gov (identifier number: NCT03138122).

Comments