Abstract
Background: One-third of patients undergoing transcatheter aortic valve implantation (TAVI) have an indication for long-term oral anticoagulation (OAC).
Aims: We aimed to investigate whether continued non-vitamin K antagonist oral anticoagulant (NOAC) therapy compared with continued vitamin K antagonist (VKA) therapy during TAVI is equally safe and effective.
Methods: Consecutive patients on OAC with either NOAC or VKA undergoing transfemoral TAVI at five European centres were enrolled. The primary outcome measure was a composite of major/life-threatening bleeding, stroke, and all-cause mortality at 30 days.
Results: In total, 584 patients underwent TAVI under continued OAC with 294 (50.3%) patients receiving VKA and 290 (49.7%) patients receiving NOAC. At 30 days, the composite primary outcome had occurred in 51 (17.3%) versus 36 (12.4%) patients with continued VKA and with continued NOAC, respectively (odds ratio [OR] 0.68, 95% confidence interval [CI]: 0.43-1.07; p=0.092). Rates of major/life-threatening bleeding (OR 0.87, 95% CI: 0.52-1.47; p=0.606) and stroke (OR 1.02, 95% CI: 0.29-3.59; p=0.974) were not different between groups. In a multivariate Cox regression analysis, continued NOAC, compared with continued VKA, was associated with a lower risk for all-cause 1-year mortality (hazard ratio [HR] 0.61, 95% CI: 0.37-0.98; p=0.043). The analysis of the propensity score-matched cohort revealed similar results.
Conclusions: Continued NOAC compared with continued VKA during TAVI led to comparable outcomes with regard to the composite outcome measure indicating that continued OAC with both drugs is feasible. These hypothesis-generating results need to be confirmed by a dedicated randomised controlled trial.
Introduction
About a third of patients suffering from severe aortic stenosis undergoing transcatheter aortic valve implantation (TAVI) have an indication for long-term oral anticoagulation (OAC) with a non-vitamin K antagonist oral anticoagulant (NOAC) or a vitamin K antagonist (VKA), predominantly due to atrial fibrillation (AF)1 .
Nowadays, during certain interventions, like AF ablation2, pacemaker implantation3 and percutaneous coronary intervention4, OAC is continued throughout the procedure. This approach leads to lower rates of bleeding and similar or even lower rates of embolic complications. The effect seems to be even more pronounced in patients undergoing those procedures under continued NOAC compared with continued VKA5. In TAVI patients, 3 smaller studies678 and 1 international multicentre registry9 indicated that continuation of anticoagulation throughout a TAVI procedure appears to be safe and effective. However, a detailed analysis of continued NOAC compared with continued VKA has not been performed.
In the present study, we analysed data from 5 European high-volume centres and hypothesised that continuation of oral anticoagulation with an NOAC compared to a VKA is equally safe and efficacious.
Methods
Study population
Consecutive patients requiring long-term OAC and receiving transfemoral TAVI at 5 European tertiary centres were enrolled in a prospective, multicentre registry. Patients with continued OAC who were taking NOAC were compared with patients receiving VKA. Enrolment spanned from 2011 to 2019 and was divided into 2 periods (2011-2015 and 2016-2019) to account for time-dependent changes. Data were collected during the initial hospital stay, and follow-up was performed at 30 days post-procedure and at 12 months during ambulatory visits or by phone. The study complies with the Declaration of Helsinki, and prospective data acquisition and follow-up examinations were approved by each local ethics committee. All patients provided written informed consent.
TAVI procedure and anticoagulation management
Transfemoral TAVI candidates underwent preprocedural planning in a standard fashion, including computed tomography for assessment of the iliofemoral arteries and annular dimensions, and were discussed by the local interdisciplinary Heart Teams. Transcatheter heart valves (THV) with the CE (European Conformity) mark were included. Closure at the femoral puncture site was done after preclosure with the Prostar XL or two Perclose ProGlides (both Abbott) or with the MANTA Device (Teleflex).
OAC was continued throughout the procedure. In patients with continued anticoagulation who were treated with VKA, the international normalised ratio (INR) on the day of TAVI was targeted to be 2.0 to 2.5 except for patients with mechanical valves for whom a target INR of up to 3.5 was accepted. Among patients with continued anticoagulation who were treated with NOAC, NOAC were omitted on the morning of the procedure. During TAVI, intravenous heparin was administered targeting an activated clotting time (ACT) of 250 s or more. The administration and dose of protamine at the end of the procedure was left to the discretion of the operator.
Definition of outcome measures
All clinical outcomes were defined according to the updated definitions of the Valve Academic Research Consortium (VARC)-210. The primary outcome measure was a composite of life-threatenting/major bleeding, stroke and all-cause mortality at 30 days. Secondary endpoints included each component of the composite as well as any bleeding, any cerebrovascular accidents, vascular complications, and device success. All-cause mortality was assessed 1 year after the procedure.
Statistical analysis
Data are presented as numbers and frequencies for categorical variables and as median (interquartile range [IQR]) for continuous variables. Categorical variables were compared using Fisher’s exact test. In the case of contingency tables whose dimensionality exceeded 2×2, Pearson’s χ2 test was applied. Continuous variables were compared using the Mann-Whitney U test, after testing for variable distribution applying the Shapiro-Wilk test.
Primary and secondary outcomes were evaluated by odds ratios (OR) with corresponding 95% confidence intervals (CI) and p-values were derived from binary logistic regression with age, sex, Society of Thoracic Surgeons Predicted Risk of Mortality (STS-PROM), and date of procedure (2011-2015 vs 2016-2019) as covariates. Moreover, clinically relevant factors associated with the occurrence of the primary outcome measure were evaluated using a binary logistic regression analysis. Factors showing a p-value ≤0.1 in the univariate analysis were included in the multivariate model after excluding collinearity. The operation period, antiplatelet therapy at baseline, and the interaction term “oral anticoagulation at baseline*antiplatelet therapy at baseline” were forced into the model. Missing values were not imputed into the model.
Estimates of all-cause mortality at 1 year were analysed according to the Kaplan-Meier method, and group comparisons were made applying the log-rank test. Independent predictors of 1-year all-cause mortality were determined with a Cox proportional hazard regression model. Clinically relevant baseline variables with a p-value ≤0.1 in the univariate analysis were included after excluding collinearity. The operation period was forced into the model. Missing values were not imputed into the model.
Collinearity was assumed if R was greater than 0.70 in the bivariate correlation test, the tolerance value was below 0.10, and/or the variable inflation factor (VIF) was greater than 10.
Two different sensitivity analyses were performed to confirm the results derived from the crude cohort. First, a propensity score-matched cohort was created by adjusting for age, sex, prior myocardial infarction, prior open heart surgery, creatinine, STS-PROM, antiplatelet therapy at baseline (none vs any antiplatelet therapy), treatment period (2011-2015 vs 2016-2019) and implanted valve type, resulting in 218 comparable pairs of patients. Balance among covariates was assessed by using standardised mean differences (SMD), and effect sizes below 0.2 were considered to be small. Second, the crude cohort was separately analysed according to the treatment period (2011-2015 vs 2016-2019) to further evaluate the impact of the treatment date.
The statistical analysis was performed using SPSS Statistics version 27.0 (IBM). A p-value <0.05 was considered statistically significant.
Results
Baseline and procedural characteristics
Out of 1,317 TAVI patients included in the multicentre registry9, 584 patients were treated under continued OAC. Two hundred and ninety-four (50.3%) patients were treated under continued VKA and 290 (49.7%) under continued NOAC. Baseline characteristics are shown in Table 1. They were well balanced between groups with regard to age and sex. There were higher rates of previous myocardial infarction and cardiac surgery as well as higher creatinine values in patients treated with continued VKA compared with continued NOAC. The main indication for anticoagulation was atrial fibrillation (96.7%). Overall, patients were at high risk for thromboembolic events with a median CHA2DS2-VASc score of 5 (IQR 4-6) in both groups. The 2 most commonly used NOAC were rivaroxaban (63.4%) and apixaban (24.1%), and the median INR was 2.3 (IQR 2.1-2.7) in VKA-treated patients. Procedural details are listed in Table 2 with slight differences between groups with regard to the access site closure system, the implanted valve and postoperative anticoagulant and antithrombotic therapy. Following TAVI, the mean gradients of the aortic valve were similar in both groups, and paravalvular regurgitation was none or mild in most patients.
Table 1. Baseline characteristics.
| Crude cohort | PSM cohort | ||||||||
|---|---|---|---|---|---|---|---|---|---|
| All patients (n=584) | Patients with continuation of VKA (n=294) | Patients with continuation of NOAC (n=290) | SMD | p-value | Patients with continuation of VKA (n=218) | Patients with continuation of NOAC (n=218) | SMD | p-value | |
| Age (years) | 82 (79-85) | 82 (79-85) | 82 (78-85) | 0.03 | 0.993a | 82 (79-85) | 82 (78-86) | 0.04 | 0.586a |
| Female sex | 287 (49.1) | 141 (48.0) | 146 (50.3) | 0.05 | 0.619b | 110 (50.5) | 111 (50.9) | 0.01 | 1.000b |
| Body mass index (kg/m2) | 27.1 (24.1-30.8) n=580 | 27.1 (24.1-30.6) n=293 | 27.0 (24.1-30.8) n=287 | 0.00 | 0.950a | 27.1 (24.4-30.9) n=218 | 27.2 (24.4-30.9) n=216 | 0.04 | 0.748a |
| Hypertension | 525 (89.9) | 266 (90.5) | 259 (89.3) | 0.04 | 0.682b | 193 (88.5) | 192 (88.1) | 0.01 | 1.000b |
| Diabetes mellitus | 204 (34.9) n=583 | 102 (34.8) n=293 |
102 (35.2) n=290 |
0.01 | 0.931b | 77 (35.5) n=217 |
79 (36.2) n=218 |
0.02 | 0.920b |
| PAVD | 75 (12.8) | 39 (13.3) | 36 (12.4) | 0.03 | 0.805b | 27 (12.4) | 32 (14.7) | 0.07 | 0.576b |
| Prior AMI | 61 (10.4) | 39 (13.3) | 22 (7.6) | 0.19 | 0.030b | 13 (6.0) | 21 (9.6) | 0.14 | 0.211b |
| Prior PCI | 147 (25.2) | 81 (27.6) | 66 (22.8) | 0.11 | 0.215b | 48 (22.0) | 53 (24.3) | 0.05 | 0.650b |
| Prior open heart surgery | 87 (14.9) | 57 (19.4) | 30 (10.3) | 0.26 | 0.002b | 29 (13.3) | 25 (11.5) | 0.06 | 0.663b |
| Prior stroke | 90 (15.4) | 49 (16.7) | 41 (14.1) | 0.07 | 0.424b | 31 (14.2) | 25 (11.5) | 0.08 | 0.474b |
| Prior pacemaker implantation | 114 (19.5) | 60 (20.4) | 54 (18.6) | 0.05 | 0.603b | 38 (17.4) | 40 (18.3) | 0.02 | 0.901b |
| Haemoglobin (g/l) | 124 (111-136) n=583 | 124 (111-136) n=293 | 124 (111-137) n=290 | 0.00 | 0.936a | 124 (112-138) n=218 | 124 (111-137) n=218 | 0.07 | 0.656a |
| Creatinine (µmol/l) | 95 (76-123) n=582 | 98 (77-137) n=293 |
90 (74-112) n=289 | 0.30 | 0.001a | 95 (74-126) n=218 |
93 (76-117) n=218 | 0.02 | 0.866a |
| CHA2DS2-VASc score | 5 (4-6) n=537 | 5 (4-6) n=274 | 5 (4-6) n=263 | 0.07 | 0.468a | 5 (4-6) n=206 | 5 (4-6) n=199 | 0.15 | 0.149a |
| STS-PROM (%) | 4.8 (3.2-7.8) n=580 | 4.6 (3.3-8.0) n=291 |
4.9 (3.2-7.8) n=289 |
0.00 | 0.665a | 4.3 (3.0-7.4) n=218 | 4.9 (3.2-7.9) n=218 | 0.11 | 0.185a |
| INR in patients on VKA | n.a. | 2.3 (2.1-2.7) | n.a. | n.a. | n.a. | 2.3 (2.1-2.8) | – | n.a. | n.a. |
| Aortic valve area (cm²) | 0.7 (0.6-0.9) n=541 | 0.7 (0.6-0.9) n=277 |
0.7 (0.6-0.9) n=264 |
0.14 | 0.538a | 0.7 (0.6-0.8) n=211 | 0.7 (0.6-0.9) n=200 | 0.12 | 0.319a |
| Mean gradient (mmHg) | 37 (28-46) n=550 | 36 (26-44) n=284 |
38 (29-47) n=266 |
0.13 | 0.143a | 38 (28-45) n=214 |
38 (29-47) n=203 |
0.01 | 0.143a |
| LV ejection fraction (%) | 56 (45-65) n=546 | 56 (45-65) n=284 |
57 (45-65) n=262 |
0.01 | 0.977a | 60 (50-65) n=214 |
57 (45-65) n=201 |
0.07 | 0.337a |
| Type of anticoagulation | – | – | – | n.a. | <0.001c | – | – | n.a. | <0.001c |
| VKA | 294 (50.3) | 294 (100) | – | – | – | 218 (100) | – | – | – |
| NOAC | 290 (49.7) | – | 290 (100) | – | – | – | 218 (100) | – | – |
| Rivaroxaban | – | – | 184 (63.4) | – | – | – | 139 (63.8) | – | – |
| Apixaban | – | – | 70 (24.1) | – | – | – | 57 (26.1) | – | – |
| Edoxaban | – | – | 4 (1.4) | – | – | – | 4 (1.8) | – | – |
| Dabigatran | – | – | 32 (11.0) | – | – | – | 18 (8.3) | – | – |
| Indication for anticoagulation | n=517 | n=257 | n=260 | 0.15 | 0.242c | n=188 | n=199 | 0.01 | 1.000b |
| Atrial fibrillation | 500 (96.7) | 246 (95.7) | 254 (97.7) | – | – | 184 (97.9) | 195 (98.0) | – | – |
| DVT/PE | 13 (2.5) | 7 (2.7) | 6 (2.3) | – | – | 4 (2.1) | 4 (2.0) | – | – |
| Mechanical heart valve | 3 (0.6) | 3 (1.2) | 0 (0) | – | – | 0 (0) | 0 (0) | – | – |
| Rare causes | 1 (0.2) | 1 (0.2) | 0 (0) | – | – | 0 (0) | 0 (0) | – | – |
| Antiplatelet therapy at baseline (dichotomous) | – | – | – | 0.20 | 0.018b | – | – | 0.00 | 1.000b |
| None | 500 (85.6) | 262 (89.1) | 238 (82.1) | 191 (87.6) | 191 (87.6) | ||||
| Any ASA and/or P2Y12 inhibitor | 84 (14.4) | 32 (10.9) | 52 (17.9) | – | – | 27 (12.4) | 27 (12.4) | – | – |
| Antiplatelet therapy at baseline (trichotomous) | – | – | – | 0.13 | 0.007c | – | – | 0.08 | 0.038c |
| None | 500 (85.6) | 262 (89.1) | 238 (82.1) | – | – | 191 (87.6) | 191 (87.6) | – | – |
| ASA or P2Y12 inhibitor | 73 (12.5) | 24 (8.2) | 49 (16.9) | – | – | 19 (8.7) | 26 (11.9) | – | – |
| ASA and P2Y12 inhibitor | 11 (1.9) | 8 (2.7) | 3 (1.0) | – | – | 8 (3.7) | 1 (0.5) | – | – |
| Treatment period | – | – | – | 0.13 | 0.114b | – | – | 0.01 | 1.000b |
| 2011-2015 | 305 (52.2) | 144 (49.0) | 161 (55.5) | – | – | 114 (52.3) | 115 (52.8) | – | – |
| 2015-2019 | 279 (47.8) | 150 (51.0) | 129 (44.5) | – | – | 104 (47.7) | 103 (47.2) | – | – |
| aMann-Whitney U test, bFisher’s exact test, cPearson’s χ² test. Data are displayed as n (%) or median (interquartile range). Body mass index is the weight in kilograms divided by the square of the height in metres. CHA2DS2-VASc score is an index of the risk of stroke in patients with atrial fibrillation. AMI: acute myocardial infarction; ASA: acetylsalicylic acid; DVT: deep vein thrombosis; INR: international normalised ratio; LV: left ventricular; n.a.: not applicable; NOAC: non-vitamin K antagonist oral anticoagulant; PAVD: peripheral arterial vascular disease; PCI: percutaneous coronary intervention; PE: pulmonary embolism; PSM: propensity score-matched; SMD: standardised mean difference; STS-PROM: Society of Thoracic Surgeons Predicted Risk of Mortality; TAVI: transcatheter aortic valve implantation; VKA: vitamin K antagonist | |||||||||
Table 2. Procedural characteristics.
| Crude cohort | PSM cohort | |||||||||
|---|---|---|---|---|---|---|---|---|---|---|
| All patients (n=584) | Patients with continuation of VKA (n=294) | Patients with continuation of NOAC (n=290) | SMD | p-value | Patients with continuation of VKA (n=218) | Patients with continuation of NOAC (n=218) | SMD | p-value | ||
| TAVI in conscious sedation | 545 (93.3) | 267 (90.8) | 278 (95.9) | 0.20 | 0.019b | 201 (92.2) | 206 (94.5) | 0.09 | 0.443b | |
| Embolic protection device | 19 (3.3) | 7 (2.4) | 12 (4.1) | 0.10 | 0.253b | 6 (2.8) | 5 (2.3) | 0.03 | 1.000b | |
| Closure device | n=578 | n=290 | n=288 | 0.28 | 0.001c | n=215 | n=216 | 0.21 | 0.008c | |
| ProGlide | 506 (87.5) | 239 (82.4) | 267 (92.7) | – | – | 183 (85.1) | 202 (93.5) | – | – | |
| ProStar | 36 (6.2) | 27 (9.3) | 9 (3.1) | – | – | 9 (4.2) | 7 (3.2) | – | – | |
| Manta | 36 (6.2) | 24 (8.3) | 12 (4.2) | – | – | 23 (10.7) | 7 (3.2) | – | – | |
| Implanted valve | – | – | – | 0.13 | 0.028c | – | – | 0.02 | 0.439c | |
| Self-expanding | 357 (61.1) | 164 (55.8) | 193 (66.6) | – | – | 134 (61.5) | 143 (65.6) | – | – | |
| Balloon-expandable | 190 (32.5) | 109 (37.1) | 81 (27.9) | – | – | 67 (30.7) | 64 (29.7) | – | – | |
| Mechanically expanding | 37 (6.3) | 21 (7.1) | 16 (5.5) | – | – | 17 (7.8) | 11 (5.0) | – | – | |
| Echo before discharge | Aortic valve area (cm2) |
1.8 (1.5–2.2) n=323 | 1.8 (1.5–2.2) n=149 | 1.8 (1.5–2.2) n=174 | 0.04 | 0.791a | 1.8 (1.5–2.2) n=98 | 1.8 (1.5–2.2) n=127 | 0.08 | 0.509a |
| Mean gradient (mmHg) | 8 (5–11) n=554 | 7 (5–11) n=281 |
8 (6–11) n=273 |
0.08 | 0.253a | 7 (5–11) n=207 |
8 (6–11) n=206 |
0.18 | 0.063a | |
| LV ejection fraction (%) |
58 (49–64) n=548 | 57 (49–64) n=276 | 59 (49–65) n=272 | 0.05 | 0.477a | 58 (50–64) n=203 | 59 (50–65) n=205 | 0.05 | 0.592a | |
| Paravalvular AI ≥2 | 21 (3.8) n=551 | 10 (3.6) n=281 |
11 (4.1) n=270 |
0.03 | 0.826b | 6 (2.9) n=207 |
6 (2.9) n=204 |
0.00 | 1.000b | |
| Anticoagulation therapy at discharge | 524 (91.8) n=571 | 255 (90.4) n=282 |
269 (93.1) n=289 |
0.10 | 0.287b | 184 (88.0) n=209 | 203 (93.5) n=217 | 0.19 | 0.064b | |
| Specific anticoagulation at discharge | n=571 | n=282 | n=289 | n.a. | <0.001c | n=209 | n=217 | n.a. | <0.001c | |
| none | 47 (8.2) | 27 (9.6) | 20 (6.9) | – | – | 25 (12.0) | 14 (6.5) | – | – | |
| VKA | 297 (52.0) | 236 (83.7) | 61 (21.1) | – | – | 170 (81.3) | 41 (18.9) | – | – | |
| NOAC | 227 (39.8) | 19 (6.7) | 208 (72.0) | – | – | 14 (6.7) | 162 (74.7) | – | – | |
| Antiplatelet therapy at discharge | n=576 | n=286 | n=290 | 0.04 | 0.002c | n=211 | n=218 | 0.14 | 0.014c | |
| None | 171 (29.7) | 97 (33.9) | 74 (25.5) | – | – | 61 (28.9) | 63 (28.9) | – | – | |
| ASA or P2Y12 inhibitor | 345 (59.9) | 151 (52.8) | 194 (66.9) | – | – | 116 (55.0) | 139 (63.8) | – | – | |
| ASA and P2Y12 inhibitor | 60 (10.4) | 38 (13.3) | 22 (7.6) | – | – | 34 (16.1) | 16 (7.3) | – | – | |
| aMann-Whitney U test, bFisher’s exact test, cPearson’s χ² test. Data are displayed as n (%) or median (interquartile range). AI: aortic insufficiency: ASA: acetylsalicylic acid; LV: left ventricular; n.a.: not applicable; NOAC: non-vitamin K antagonist oral anticoagulant; PSM: propensity score-matched; SMD: standardised mean difference; TAVI: transcatheter aortic valve implantation; VKA: vitamin K antagonist | ||||||||||
Primary outcome measure and its predictors
At 30-day follow-up, the composite of major/life-threatening bleeding, stroke and all-cause mortality was similar in patients treated under continued NOAC versus continued VKA (OR 0.68, 95% CI: 0.43-1.07; p=0.092) (Table 3). Major/life-threatening bleeding had occurred in 31 (10.7%) patients with continued NOAC and in 35 (11.9%) patients with continued VKA (p=0.606). Stroke was rare and occurred in 5 (1.7%) patients in each group (p=0.974). The 30-day mortality was significantly lower in patients treated under continued NOAC (2 [0.7%] patients) compared with continued VKA (15 [5.1%] patients, OR 0.13, 95% CI: 0.03-0.58; p=0.007) (Table 3, Central illustration). A detailed description of the causes of death until day 30 is provided in Supplementary Table 1.
Independent predictors for the primary composite outcome are outlined in Table 4 and included female sex (OR 1.83, 95% CI: 1.10-3.03) and baseline haemoglobin (OR 0.98 per g/l, 95% CI: 0.97-0.99), whereas antiplatelet therapy at baseline was not associated with the primary composite outcome. There was also no interaction between NOAC versus VKA and antiplatelet therapy at baseline (p=0.742).
Moreover, the treatment date was also not associated with the primary composite outcome. To further investigate the impact of the treatment period (2011-2015 vs 2016-2019), we evaluated baseline, procedural and outcome characteristics according to the previously mentioned treatment periods. Although patients treated between 2016 and 2019 had a lower overall risk, the primary composite outcome showed consistent results between NOAC and VKA in both cohorts (Supplementary Table 1-Supplementary Table 4).
Table 3. Primary and secondary outcomes at 30 days.
| Crude cohort | PSM cohort | |||||||
|---|---|---|---|---|---|---|---|---|
| All patients (n=584) | Patients with continuation of VKA (n=294) | Patients with continuation of NOAC (n=290) | OR (95% CI) p-valuea | Patients with continuation of VKA (n=218) | Patients with continuation of NOAC (n=218) | OR (95% CI) p-valueb | ||
| Primary outcome | Primary outcome composite | 87 (14.9) | 51 (17.3) | 36 (12.4) | 0.68 (0.43-1.07) p=0.092 | 40 (18.3) | 26 (11.9) | 0.60 (0.35-1.03) p=0.063 |
| Major/life-threatening bleeding | 66 (11.3) | 35 (11.9) | 31 (10.7) | 0.87 (0.52-1.47) p=0.606 | 27 (12.4) | 22 (10.1) | 0.79 (0.44-1.44) p=0.794 | |
| Stroke | 10 (1.7) | 5 (1.7) | 5 (1.7) | 1.02 (0.29-3.59) p=0.974 | 3 (1.4) | 4 (1.8) | 1.34 (0.30-6.06) p=0.704 | |
| Mortality | 17 (2.9) | 15 (5.1) | 2 (0.7) | 0.13 (0.03-0.58) p=0.007 | 12 (5.5) | 2 (0.9) | 0.16 (0.04-0.72) p=0.017 | |
| Secondary outcomes | Any bleeding | 145 (24.8) | 78 (26.5) | 67 (23.1) | 0.80 (0.55-1.18) p=0.261 | 57 (26.1) | 50 (22.9) | 0.84 (0.54-1.30) p=0.436 |
| Any cerebrovascular event including stroke and TIA | 17 (2.9) | 8 (2.7) | 9 (3.1) | 1.14 (0.43-3.00) p=0.797 | 5 (2.3) | 7 (3.2) | 1.41 (0.44-4.52) p=0.560 | |
| Vascular complications | Major | 64 (11.0) | 33 (11.2) | 31 (10.7) | 0.91 (0.54-1.55) p=0.738 | 27 (12.4) | 20 (9.2) | 0.72 (0.39-1.32) p=0.281 |
| Minor | 87 (14.9) | 47 (16.0) | 40 (13.8) | 0.80 (0.50-1.27) p=0.345 | 37 (17.0) | 30 (13.8) | 0.78 (0.46-1.32) p=0.353 | |
| Closure device failure | 13 (2.2) | 6 (2.0) | 7 (2.4) | 1.20 (0.39-3.63) p=0.752 | 2 (0.9) | 6 (2.8) | 3.06 (0.61-15.31) p=0.174 | |
| Need for vascular surgery | 7 (1.2) | 5 (1.7) | 2 (0.7) | 0.44 (0.08-2.30) p=0.330 | 5 (2.3) | 2 (0.9) | 0.39 (0.08-2.06) p=0.269 | |
| Need for packed red blood cell transfusion | 80 (13.7) | 35 (11.9) | 45 (15.5) | 1.34 (0.82-2.17) p=0.244 | 26 (11.9) | 36 (16.5) | 1.46 (0.85-2.52) p=0.172 | |
| Device success | 537 (92.0) | 263 (89.5) | 274 (94.5) | 2.03 (1.08-3.80) p=0.028 | 200 (91.7) | 208 (95.4) | 1.87 (0.84-4.15) p=0.123 | |
| Values are n (%). aOdds ratios and p-values have been derived from binary logistic regression with age, sex, STS-PROM, and date of procedure (2011-2015 vs 2016-2019) as covariates. bOdds ratios and p-values have been derived from binary logistic regression without further adjustments in the PSM cohort. Device success defined according to VARC-2 criteria. CI: confidence interval; NOAC: non-vitamin K antagonist oral anticoagulant; OR: odds ratio; PSM: propensity score-matched; STS-PROM: Society of Thoracic Surgeons Predicted Risk of Mortality; TIA: transient ischaemic attack; VARC: Valve Academic Research Consortium; VKA: vitamin K antagonist | ||||||||
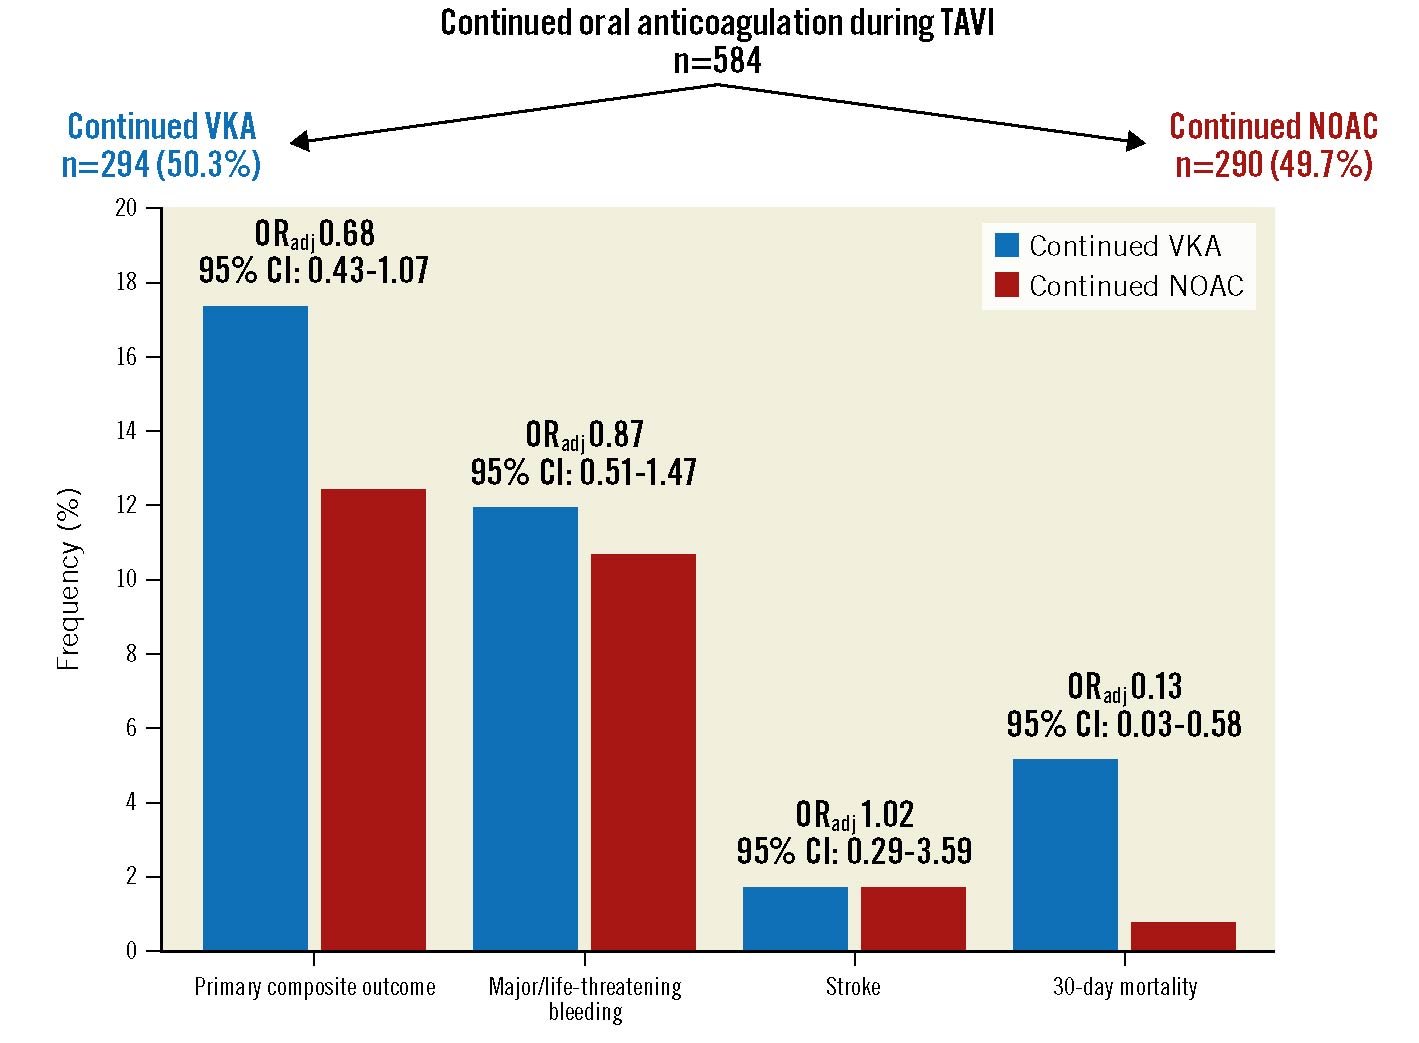
Central illustration. The primary composite outcome measure and its single components in patients with continued vitamin K antagonist (VKA) compared with non-vitamin K antagonist oral anticoagulant (NOAC) therapy during the TAVI procedure. CI: confidence interval; ORadj: adjusted odds ratio; TAVI: transcatheter aortic valve implantation
Table 4. Predictors for the primary outcome.
| Univariate analysis | Multivariate analysis | |||
|---|---|---|---|---|
| OR (95% CI) | p-value | OR (95% CI) | p-value | |
| NOAC vs VKA | 0.68 (0.43-1.07) | 0.095 | 0.60 (0.32-1.12) | 0.106 |
| Age (years) | 1.02 (0.98-1.06) | 0.396 | – | – |
| Female sex | 1.75 (1.10-2.79) | 0.018 | 1.83 (1.10-3.03) | 0.019 |
| Body mass index (kg/m2) |
1.01 (0.97-1.05) | 0.703 | – | – |
| Hypertension | 0.969 (0.46-2.05) | 0.935 | – | – |
| Diabetes mellitus | 1.10 (0.68-1.76) | 0.704 | – | – |
| PAVD | 1.67 (0.91-3.07) | 0.096 | 1.70 (0.90-3.23) | 0.103 |
| Prior AMI | 1.84 (0.96-3.50) | 0.065 | 1.36 (0.66-2.80) | 0.410 |
| Prior PCI | 1.71 (1.05-2.79) | 0.031 | 1.68 (0.95-2.98) | 0.076 |
| Prior open heart surgery | 0.90 (0.47-1.74) | 0.754 | – | – |
| Prior stroke | 1.29 (0.71-2.34) | 0.405 | – | – |
| Prior pacemaker implantation | 1.09 (0.62-1.92) | 0.766 | – | – |
| Haemoglobin (per 1 g/l increase) |
0.98 (0.97-0.99) | <0.001 | 0.98 (0.97-0.99) | 0.001 |
| Creatinine (per 10 µmol/l increase) | 1.01 (0.99-1.04) | 0.372 | – | – |
| STS-PROM (per 1% increase) |
1.05 (1.01-1.08) | 0.017 | 1.02 (0.98-1.06) | 0.431 |
| LV ejection fraction (per 10% decrease) | 0.98 (0.83-1.16) | 0.794 | – | – |
| Antiplatelet therapy at baseline (yes vs no) |
1.56 (0.87-2.81) | 0.140 | 1.37 (0.71-2.64) | 0.352 |
| Interaction OAC at baseline*antiplatelet therapy at baselinea | 1.42 (0.57-3.57) | 0.453 | 0.74 (0.21-2.57) | 0.742 |
| Operation period (2011-2015 vs 2016-2019) | 0.92 (0.58-1.45) | 0.716 | 0.90 (0.55-1.47) | 0.674 |
| Binary logistic regression using clinically relevant parameters and/or variables with p≤0.1 in univariate analysis. aInteraction term between NOAC vs VKA and antiplatelet therapy at baseline. AMI: acute myocardial infarction; CI: confidence interval; LV: left ventricular; NOAC: non-vitamin K antagonist oral anticoagulant; OAC: oral anticoagulant; OR: odds ratio; PAVD: peripheral arterial vascular disease; PCI: percutaneous coronary intervention; STS-PROM: Society of Thoracic Surgeons Predicted Risk of Mortality; VKA: vitamin K antagonist | ||||
Secondary outcomes
Secondary outcomes are displayed in Table 3 and showed comparable results between groups, except for a higher device success rate for patients treated under continued NOAC compared to VKA.
One-year all-cause mortality and its predictors
The median duration of follow-up was 343 days (IQR 78–400) in the VKA group and 362 days (IQR 91–397) in the NOAC group (p=0.332). Of the patients who survived the first 30 days, 151/279 (54.1%) and 164/288 (56.9%) had a follow-up of 365±7 days in the VKA and NOAC groups, respectively (p=0.500). Kaplan-Meier estimates of 1-year all-cause mortality were 9.7% for patients treated under continued NOAC and 16.4% for patients treated under continued VKA (p-value by log-rank test 0.014) (Figure 1). A landmark analysis revealed that the mortality benefit seen at 1 year was caused by a lower 30-day mortality in the group receiving NOAC compared to VKA, whereas mortality from day 31-365 was comparable between groups (Supplementary Figure 1). In a multivariate Cox regression analysis, continued NOAC, compared with continued VKA, was associated with a lower risk for 1-year all-cause mortality (HR 0.61, 95% CI: 0.37-0.98; p=0.043). Another independent predictor was baseline creatinine (HR 1.04 for 10 μmol/l increase, 95% CI: 1.01-1.06) (Table 5).
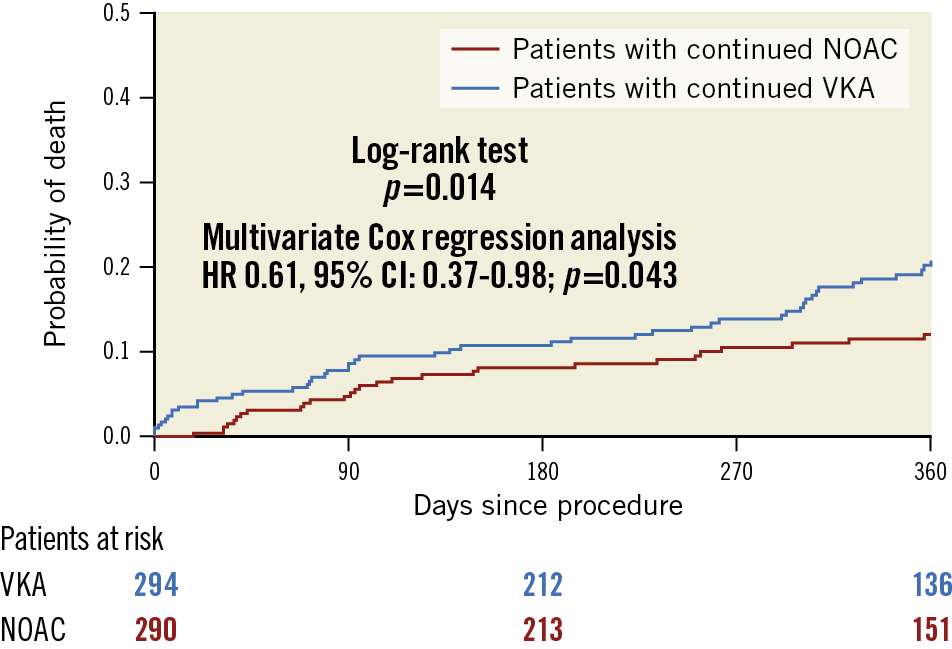
Figure 1. Kaplan-Meier estimates of mortality in patients in the crude cohort with continued vitamin K antagonist (VKA) compared with non-vitamin K antagonist oral anticoagulant (NOAC) therapy during the TAVI procedure. CI: confidence interval; HR: hazard ratio; TAVI: transcatheter aortic valve implantation
Table 5. Cox proportional hazard regression model for 1-year all-cause mortality.
| Univariate analysis | Multivariate analysis | |||
|---|---|---|---|---|
| HR (95% CI) | p-value | HR (95% CI) | p-value | |
| NOAC vs VKA | 0.56 (0.35-0.90) | 0.015 | 0.61 (0.37-0.98) | 0.043 |
| Age (years) | 1.01 (0.97-1.05) | 0.692 | – | – |
| Female sex | 0.83 (0.53-1.30) | 0.420 | – | – |
| Body mass index (kg/m2) | 1.01 (0.97-1.05) | 0.790 | – | – |
| Hypertension | 0.71 (0.34-1.49) | 0.367 | – | – |
| Diabetes mellitus | 1.56 (1.00-2.45) | 0.051 | 1.24 (0.76-2.02) | 0.385 |
| PAVD | 1.60 (0.89-2.86) | 0.111 | – | – |
| Prior AMI | 1.53 (0.82-2.82) | 0.179 | – | – |
| Prior PCI | 1.64 (1.02-2.61) | 0.040 | 1.48 (0.91-2.42) | 0.119 |
| Prior open heart surgery | 0.86 (0.44-1.67) | 0.651 | – | – |
| Prior stroke | 1.11 (0.61-2.01) | 0.742 | – | – |
| Prior pacemaker implantation | 0.95 (0.54-1.70) | 0.873 | – | – |
| Haemoglobin (per 1 g/l increase) |
0.99 (0.98-1.00) | 0.062 | 0.99 (0.98-1.00) | 0.135 |
| Creatinine (per 10 µmol/l increase) | 1.02 (1.01-1.04) | 0.003 | 1.04 (1.01-1.06) | 0.005 |
| STS-PROM (per 1% increase) |
1.04 (1.01-1.07) | 0.004 | 1.03 (1.00-1.06) | 0.102 |
| LV ejection fraction (per 10% decrease) | 1.24 (1.06-1.44) | 0.006 | 1.17 (1.00-1.38) | 0.056 |
| Antiplatelet therapy prior to TAVI (yes vs no) |
1.53 (0.87-2.68) | 0.143 | – | – |
| Operation period (2011-2015 vs 2016-2019) | 1.01 (0.64-1.59) | 0.965 | 1.02 (0.63-1.66) | 0.926 |
| Cox regression analysis using clinical relevant parameters and/or variables with p≤0.1in univariate analysis. AMI: acute myocardial infarction; CI: confidence interval; HR: hazard ratio; LV: left ventricular; NOAC: non-vitamin K antagonist oral anticoagulant; PAVD: peripheral arterial vascular disease; PCI: percutaneous coronary intervention; STS-PROM: Society of Thoracic Surgeons Predicted Risk of Mortality; TAVI: transcatheter aortic valve implantation; VKA: vitamin K antagonist | ||||
Propensity score-matched cohort
Propensity score matching resulted in 218 pairs of comparable patients. The baseline and procedural characteristics are shown in Table 1 and Table 2; the primary composite outcome measure, its components and secondary outcomes are shown in Table 3. The results derived in this cohort resembled the ones of the crude cohort, with the primary composite outcome measure not significantly different between groups (OR 0.60, 95% CI: 0.35-1.03; p=0.063) and a lower 1-year all-cause mortality in the NOAC group compared with the VKA group (HR 0.55, 95% CI: 0.32-0.95) (Figure 2), predominantly caused by a lower 30-day mortality (Supplementary Figure 2).
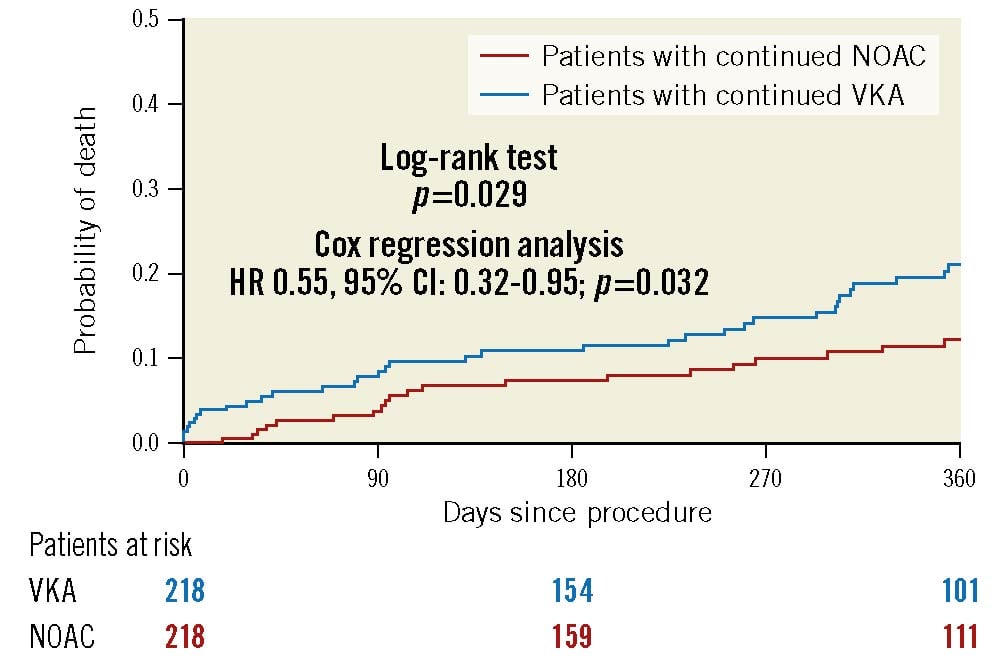
Figure 2. Kaplan-Meier estimates of mortality in patients in the propensity score-matched cohort with continued vitamin K antagonist (VKA) compared with non-vitamin K antagonist oral anticoagulant (NOAC) therapy during the TAVI procedure. CI: confidence interval; HR: hazard ratio; TAVI: transcatheter aortic valve implantation
Discussion
The main finding of our multicentre observational analysis is that both continued NOAC and continued VKA led to similar rates of the primary composite outcome, consisting of major/life-threatening bleeding, stroke and all-cause mortality at 30 days. In particular bleeding and thrombotic events were comparable between groups, whereas 30-day mortality was lower in patients treated with continued NOAC compared with continued VKA. The results were consistent in a propensity score-matched cohort and cohorts analysed according to the treatment date. These data expand our knowledge about the safety and efficacy of continued OAC during transfemoral TAVI and indicate the applicability of this approach with both NOAC and VKA. This approach may help to simplify periprocedural planning and patient management.
The problem
The use of TAVI has increased tremendously over the last decade with a concomitant reduction in periprocedural morbidity and mortality11. Approximately 180,000 patients can be considered potential TAVI candidates in the European Union and in Northern America annually. This number might increase up to 270,000 if treatment for TAVI expands to low-risk patients. Approximately one-third of TAVI candidates suffer from atrial fibrillation with an indication for oral anticoagulation. To optimise TAVI procedures, a minimalistic approach has been proposed12; this might include performing TAVI under continued OAC.
the concerns about continued OAC
The decision about whether to continue or discontinue OAC during cardiovascular interventions has to balance the risk between thromboembolic and bleeding complications. Several trials in different procedures including AF ablation2, pacemaker implantation3, and percutaneous coronary intervention4 have shown non-inferiority or even superiority of continued compared with discontinued OAC regarding both bleeding and thromboembolic complications. Those effects seem to be even more pronounced in patients undergoing certain procedures under continued NOAC compared with continued VKA5. In contrast, discontinuation of OAC and bridging with heparin is associated with an increased risk of bleeding in cardiac and non-cardiac interventions1314. With regard to TAVI, recent observational data suggest that TAVI under continued OAC is safe and effective789, with a potential advantage for continued NOAC compared with continued VKA7. Generally, NOAC have overtaken VKA as the major treatment prescribed to new oral anticoagulant patients, and the number of starters on VKA is decreasing15. It remains a clinically important question whether there is a difference between continued NOAC compared with continued VKA in patients undergoing TAVI. Therefore, we used the data of a multicentre registry to evaluate the impact of continued NOAC compared with continued VKA. The impact of continued versus interrupted OAC has been published previously9.
Bleeding and thromboembolic events
Both bleeding and thromboembolic complications (e.g., stroke) impact mortality and morbidity16. Therefore, we chose the composite of major/life-threatening bleeding, stroke and 30-day mortality as the primary outcome measure to evaluate the impact of the periprocedural management adoption of continued NOAC compared with continued VKA. This composite outcome was not different between groups, and its occurrence was associated with female sex and baseline haemoglobin.
Regarding the individual components, major/life-threatening bleeding at 30 days was comparable between patients receiving TAVI under continued NOAC compared with continued VKA, confirming the results derived in subgroups of previously published analyses78. Moreover, any bleedings were also not different between groups. Interpreting these event rates in the context of the current literature, one has to consider several points. First, although being a prospective multicentre registry including real-world, consecutive patients, they were not randomised, neither for continuation of anticoagulation nor for the type of OAC. Data collection was done by each centre without monitoring. Second, the 3 main published randomised clinical trials of anticoagulant therapy in TAVI patients with an indication for OAC171819 focused on post-procedural management, e.g., after a successful TAVI procedure and not on periprocedural issues. Third, in the present study the proportion of patients additionally receiving single or even double antiplatelet therapy was about two-thirds, which is significantly higher than in the aforementioned trials, reflecting the clinical practice at the time of treatment. We accounted for the factor “antiplatelet therapy at baseline” in our multivariate analysis and the propensity score-matched cohort and found no influence on the primary composite outcome measure. Moreover, prior PCI showed a borderline association with the primary outcome measure in our analysis, a finding which we interpret as a marker for coronary artery disease that is known to identify AF patients at increased risk for cardiovascular events2. Fourth, different definitions of bleeding severity, e.g., the International Society on Thrombosis and Haemostasis (ISTH) definitions in the ENVISAGE-TAVI AF trial19, the Bleeding Academic Research Consortium (BARC) definitions in ATLANTIS17 and differentiation into procedural and non-procedural bleeding in POPular TAVI18, make comparisons across studies difficult.
Although declining in number, major/life-threatening bleeding events after TAVI are still frequent complications1120 and have been associated with worse outcomes16. The incidence of major/life-threatening bleeding is in the expected range for TAVI during the treatment period as described in cohort studies involving both patients with and without an indication for OAC11. Moreover, in the randomised controlled trial PARTNER II, the rate of life-threatening/disabling bleeding (not including major bleeding) and any stroke was 10.5% and 5.6% in the TAVI group at 30 days, respectively21. The mechanism of bleeding is mainly related to vascular access site complications22. In line with that, we found no differences for major and minor vascular complications between groups.
Regarding cerebrovascular events, we documented low rates of stroke with no significant differences between groups despite a high thromboembolic risk (median CHA2DS2-VASc score 5). The absolute values are comparable to other reports11 with a median incidence of 4% described in a meta-analysis of 72,318 patients23. However, self-reported stroke rates without prospective neurological evaluation likely underestimate true numbers and range from 9% up to 29% when systematic neurological assessment and neuroimaging is performed.2425 Therefore, the self-reported stroke rates in our analysis might be underrated. Peri-interventional cerebrovascular events are mainly caused by embolism of acute thrombus, calcified valve and artery wall tissue, and foreign material. Those materials can be found regularly in embolic protection devices25. Since acute thrombus is found in up to 90% of histopathologically examined neuroprotection filters26, continuation of a pre-existing VKA or NOAC therapy appears to be a logical conclusion, with comparable outcomes for both drugs in our analysis. Post-procedure, new-onset or previously undetected atrial fibrillation is one of the most important predictors of stroke1. In particular, undiagnosed pre-existing AF appears to be more hazardous due to a lack of appropriate therapy. Extensive pre- and post-procedural monitoring can potentially improve diagnosis and treatment27.
Mortality
The 30-day all-cause mortality was lower in patients treated with NOAC compared with VKA, even after adjusting for age, sex, STS score, and date of the procedure (2011-2015 vs 2016-2019). Moreover, all-cause mortality at 1 year was lower in patients initially treated with NOAC, primarily caused by the lower 30-day mortality as shown in the landmark analysis. These findings were similar in a propensity score-matched cohort. We can only hypothesise about the reasons for this mortality pattern, which needs to be interpreted very cautiously due to the non-randomised, observational design of the analysis and the risk of a finding by chance. Despite adjusting for differences in baseline characteristics (e.g., renal function) and procedural results (e.g., device success), unmeasured confounders may have contributed to this finding. On the one hand, our findings mirror the results found in regular AF populations with a significantly reduced all-cause mortality in NOAC-treated compared with VKA-treated patients28.On the other hand, dedicated randomised trials comparing NOAC versus VKA in AF patients after TAVI failed to show superiority, indicating that the specific cohort of TAVI patients with AF is not comparable to the general AF population171819. At least in the subgroup of NOAC-treated patients included in the POPular TAVI trial18, a lower rate of the 2 primary endpoints of all bleeding and non-procedure-related bleeding over a period of 12 months was obvious, but numbers were low, and the trial was not powered to assess the differences between NOAC and VKA.
Observational studies comparing NOAC with VKA after TAVI have provided inconsistent findings29. To draw meaningful conclusions, further trials are necessary. In particular, regarding the subject of continued versus interrupted OAC during TAVI, the POPular PAUSE TAVI (Periprocedural Continuation Versus Interruption of Oral Anticoagulant Drugs During Transcatheter Aortic Valve Implantation) trial (ClinicalTrials.gov: NCT04437303) is eagerly awaited.
Limitations
We are well aware of certain limitations in our study. Although data were analysed from a prospective multicentre registry including real-world, consecutive patients, patients were not randomised, neither to continuation or interruption nor type of anticoagulation. Second, all bias inherent to a retrospectively evaluated, unmonitored multicentre registry have to be taken into account while interpreting these data. Third, the time period lasted from 2011 to 2019, a time during which TAVI underwent many technical and procedural changes. Although we found comparable rates of NOAC versus VKA over time and adjusted our results to the treatment period via multivariate analysis and propensity score matching, and analysed every treatment period separately, influences by latest-device iterations, improved imaging and patient selection, as well as operator experience, cannot be excluded. Fourth, the NOAC group comprised different active ingredients with a predominance of rivaroxaban, thus no conclusions can be made on single agents. Fifth, there was a high rate of concomitant antiplatelet therapy in both cohorts, reflecting the clinical practice at the time of treatment. Nowadays, antiplatelets are no longer used for TAVI patients in need of OAC unless they have a certain indication, e.g., recent PCI. Sixth, reflecting the hypothesis-generating character of our analysis, no adjustment for multiple testing or analysis of competing risk was performed. Finally, long-term results need to be interpreted against the background of a relevant crossover after TAVI implantation in both groups, with a higher rate in the NOAC group compared to VKA, as well as limited clinical information beyond survival status at 1 year.
Conclusions
Continued NOAC compared with continued VKA throughout the TAVI procedure led to comparable outcomes with regard to the composite outcome measure of major/life-threatening bleeding, stroke and all-cause mortality at 30 days, indicating that continued OAC with both medication classes is feasible. These hypothesis-generating results need to be confirmed by randomised controlled trials examining whether continued versus interrupted OAC during TAVI is safe and effective and whether there is a difference between NOAC and VKA.
Impact on daily practice
The results from this registry with regard to the comparison of continued versus interrupted OAC during TAVI have been published separately9. In the current analysis, continued NOAC compared with continued VKA during TAVI led to comparable outcomes with regard to the composite outcome of major/life-threatening bleeding, stroke and 30-day mortality in our patient cohort. Whether continued versus interrupted OAC during TAVI is safe and effective and whether there is a difference between NOAC and VKA remains to be studied in dedicated randomised trials.
Conflict of interest statement
N. Mangner has received personal fees from Edwards Lifesciences, Medtronic, Biotronik, Novartis, Sanofi, AstraZeneca, Pfizer, Bayer, Abbott, Abiomed, and Boston Scientific, outside the submitted work. L. Keller has received fellowship funding from KK Stiftung fuer Kardiologie und Kreislauf. N. Moriyama has received a research grant from the Japanese Circulation Society; and personal fees from Edwards Lifescience, Medtronic, and Abbott, outside the submitted work. S. Haussig has received research grants to the institution from Edwards Lifesciences; and personal fees from Edwards Lifesciences, Abbott Vascular, and Boston Scientific, outside the submitted work. R. Kobza has received institutional grants from Abbott, Biosense-Webster, Biotronik, Boston Scientific, Medtronic, and SIS Medical; and serves as consultant for Biosense-Webster, and Biotronik, outside the submitted work. S. Stortecky has received research grants to the institution from Edwards Lifesciences, Medtronic, Abbott Vascular ,and Boston Scientific; and speaker fees from Boston Scientific, outside the submitted work. T. Pilgrim has received research grants to the institution from Biotronik, Boston Scientific, and Edwards Lifesciences; and speaker/consultancy fees from Biotronik, Boston Scientific, Medtronic, and Highlife SAS, outside the submitted work. S. Toggweiler is a consultant and/or proctor for Boston Scientific, Abbott Vascular, Medtronic, Edwards Lifesciences, Biosensors, Medira, Teleflex, Shockwave, Polares Medical, atHeart Medical, and Veosource; has received institutional research grants from Boston Scientific, Biosensors, and Fumedica AG; and holds equity in Hi-D Imaging, outside the submitted work. A. Linke has received personal fees from Medtronic, Abbott, Edwards Lifesciences, Boston Scientific, AstraZeneca, Novartis, Pfizer, Abiomed, Bayer, and Boehringer, outside the submitted work. The other authors have no conflicts of interest to declare.
Supplementary data
To read the full content of this article, please download the PDF.